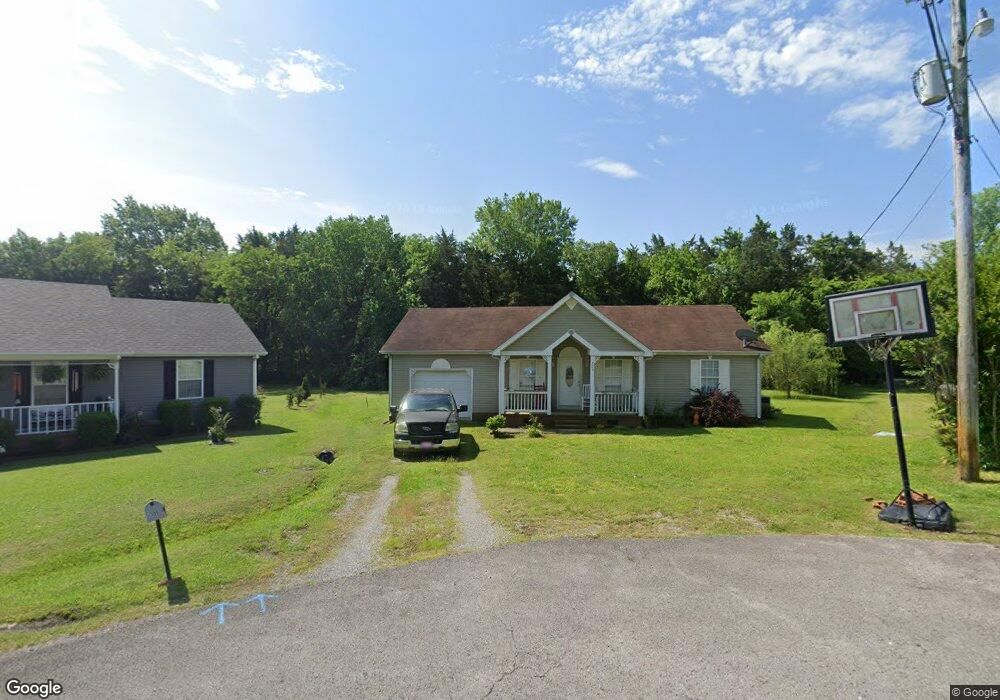
305 Russell St Shelbyville, TN 37160
Estimated Value: $253,991 - $313,000
--
Bed
2
Baths
1,340
Sq Ft
$213/Sq Ft
Est. Value
About This Home
This home is located at 305 Russell St, Shelbyville, TN 37160 and is currently estimated at $285,748, approximately $213 per square foot. 305 Russell St is a home located in Bedford County with nearby schools including South Side Elementary School, Harris Middle School, and Victory Baptist Academy.
Ownership History
Date
Name
Owned For
Owner Type
Purchase Details
Closed on
Nov 23, 2004
Sold by
Glover Chris
Bought by
Dollar Donald B
Current Estimated Value
Home Financials for this Owner
Home Financials are based on the most recent Mortgage that was taken out on this home.
Original Mortgage
$85,063
Outstanding Balance
$41,939
Interest Rate
5.6%
Estimated Equity
$243,809
Purchase Details
Closed on
Nov 22, 2004
Bought by
Dollar Donald B
Home Financials for this Owner
Home Financials are based on the most recent Mortgage that was taken out on this home.
Original Mortgage
$85,063
Outstanding Balance
$41,939
Interest Rate
5.6%
Estimated Equity
$243,809
Purchase Details
Closed on
Mar 2, 2004
Sold by
Canter Keith
Bought by
Glover Chris
Purchase Details
Closed on
Jun 12, 2003
Sold by
Hunley Debbie and Hunley Thomas
Bought by
Provident Bank
Purchase Details
Closed on
Dec 24, 1986
Bought by
Elbert Bell H and Elbert Landers
Create a Home Valuation Report for This Property
The Home Valuation Report is an in-depth analysis detailing your home's value as well as a comparison with similar homes in the area
Home Values in the Area
Average Home Value in this Area
Purchase History
| Date | Buyer | Sale Price | Title Company |
|---|---|---|---|
| Dollar Donald B | $83,600 | -- | |
| Dollar Donald B | $83,600 | -- | |
| Glover Chris | $12,000 | -- | |
| Provident Bank | $94,540 | -- | |
| Elbert Bell H | -- | -- |
Source: Public Records
Mortgage History
| Date | Status | Borrower | Loan Amount |
|---|---|---|---|
| Open | Elbert Bell H | $85,063 | |
| Previous Owner | Elbert Bell H | $20,000 |
Source: Public Records
Tax History Compared to Growth
Tax History
| Year | Tax Paid | Tax Assessment Tax Assessment Total Assessment is a certain percentage of the fair market value that is determined by local assessors to be the total taxable value of land and additions on the property. | Land | Improvement |
|---|---|---|---|---|
| 2025 | -- | $40,600 | $0 | $0 |
| 2024 | -- | $40,600 | $7,750 | $32,850 |
| 2023 | $1,545 | $40,600 | $7,750 | $32,850 |
| 2022 | $1,590 | $40,600 | $7,750 | $32,850 |
| 2021 | $1,444 | $40,600 | $7,750 | $32,850 |
| 2020 | $1,271 | $40,600 | $7,750 | $32,850 |
| 2019 | $1,271 | $28,700 | $5,750 | $22,950 |
| 2018 | $1,243 | $28,700 | $5,750 | $22,950 |
| 2017 | $1,243 | $28,700 | $5,750 | $22,950 |
| 2016 | $1,231 | $28,700 | $5,750 | $22,950 |
| 2015 | $1,231 | $28,700 | $5,750 | $22,950 |
| 2014 | $1,043 | $26,600 | $0 | $0 |
Source: Public Records
Map
Nearby Homes