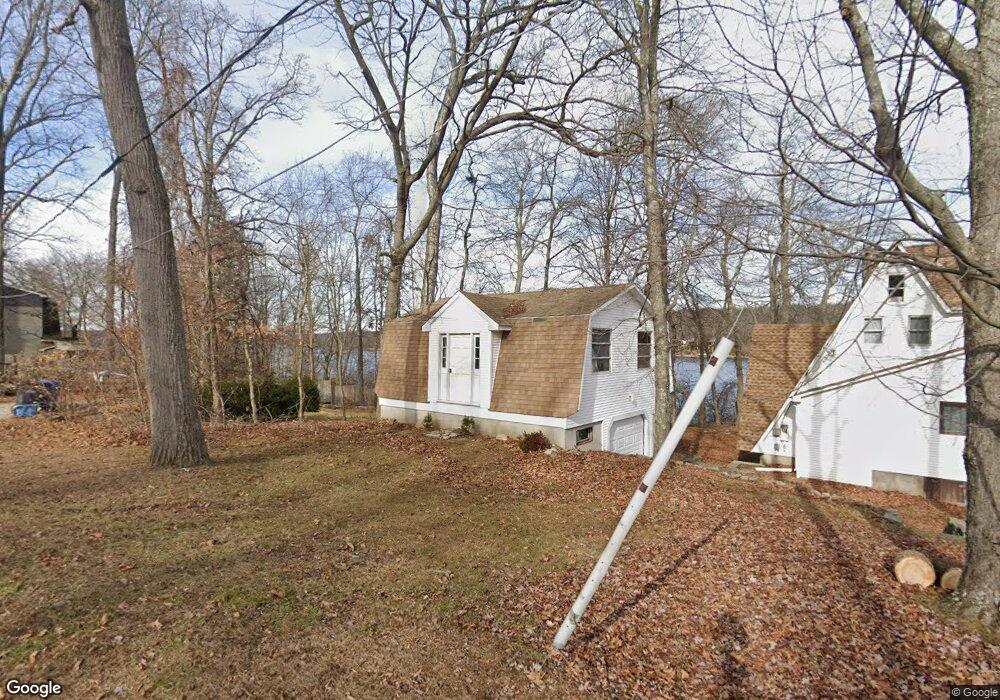
305 Shore Dr Coventry, CT 06238
Estimated Value: $325,000 - $500,000
2
Beds
1
Bath
841
Sq Ft
$520/Sq Ft
Est. Value
About This Home
This home is located at 305 Shore Dr, Coventry, CT 06238 and is currently estimated at $437,041, approximately $519 per square foot. 305 Shore Dr is a home located in Tolland County with nearby schools including George Hersey Robertson School, Coventry Grammar School, and Capt. Nathan Hale School.
Ownership History
Date
Name
Owned For
Owner Type
Purchase Details
Closed on
Oct 10, 2025
Sold by
Heemskerk Bart W
Bought by
Laura Eden Heemskerk Oath and Laura Heemskerk
Current Estimated Value
Purchase Details
Closed on
Aug 7, 2025
Sold by
Heemskerk Laura E
Bought by
Laura Eden Heemserk Oath and Laura Heemskerk
Purchase Details
Closed on
Mar 19, 2018
Sold by
Heemskerk Laura E and Heemskerk Bart W
Bought by
Heemskerk Laura E
Purchase Details
Closed on
Mar 20, 2000
Sold by
Rocco Anthony and Rocco Helma
Bought by
Heemskerk Bart and Heemskerk Laura
Home Financials for this Owner
Home Financials are based on the most recent Mortgage that was taken out on this home.
Original Mortgage
$136,000
Interest Rate
8.13%
Mortgage Type
Purchase Money Mortgage
Create a Home Valuation Report for This Property
The Home Valuation Report is an in-depth analysis detailing your home's value as well as a comparison with similar homes in the area
Home Values in the Area
Average Home Value in this Area
Purchase History
| Date | Buyer | Sale Price | Title Company |
|---|---|---|---|
| Laura Eden Heemskerk Oath | -- | -- | |
| Laura Eden Heemserk Oath | -- | -- | |
| Heemskerk Laura E | -- | -- | |
| Heemskerk Bart | $170,000 | -- | |
| Heemskerk Laura E | -- | -- | |
| Heemskerk Bart | $170,000 | -- |
Source: Public Records
Mortgage History
| Date | Status | Borrower | Loan Amount |
|---|---|---|---|
| Previous Owner | Heemskerk Bart | $200,000 | |
| Previous Owner | Heemskerk Bart | $168,000 | |
| Previous Owner | Heemskerk Bart | $136,000 |
Source: Public Records
Tax History
| Year | Tax Paid | Tax Assessment Tax Assessment Total Assessment is a certain percentage of the fair market value that is determined by local assessors to be the total taxable value of land and additions on the property. | Land | Improvement |
|---|---|---|---|---|
| 2025 | $9,212 | $387,700 | $283,400 | $104,300 |
| 2024 | $8,094 | $243,000 | $190,100 | $52,900 |
| 2023 | $7,713 | $243,000 | $190,100 | $52,900 |
| 2022 | $7,569 | $243,000 | $190,100 | $52,900 |
| 2021 | $7,569 | $243,000 | $190,100 | $52,900 |
| 2020 | $7,574 | $243,000 | $190,100 | $52,900 |
| 2019 | $7,825 | $243,000 | $190,100 | $52,900 |
| 2018 | $7,145 | $221,900 | $172,800 | $49,100 |
| 2017 | $7,101 | $221,900 | $172,800 | $49,100 |
| 2016 | $6,923 | $221,900 | $172,800 | $49,100 |
| 2015 | $6,923 | $221,900 | $172,800 | $49,100 |
| 2014 | $6,403 | $224,900 | $166,400 | $58,500 |
Source: Public Records
Map
Nearby Homes
- 198 Forest Rd
- 0 Woodland Rd
- 550 High St
- 152 Cheney Ln
- 17 Ireland Dr
- 0 Hinkel Mae Dr
- 27 Fox Trail
- 498 Root Rd
- 0 Daly Rd Unit 24146464
- 55 Whites Hill Rd
- 2478 Main St
- 103 S Street Extension
- 106 S Street Extension
- 17 Route 6
- 457 Stafford Rd
- 31 Wyllys Farm Rd
- 811 Pucker St
- 864 Boston Turnpike
- 37 Wyllys Farm Rd
- 127 U S 6
Your Personal Tour Guide
Ask me questions while you tour the home.