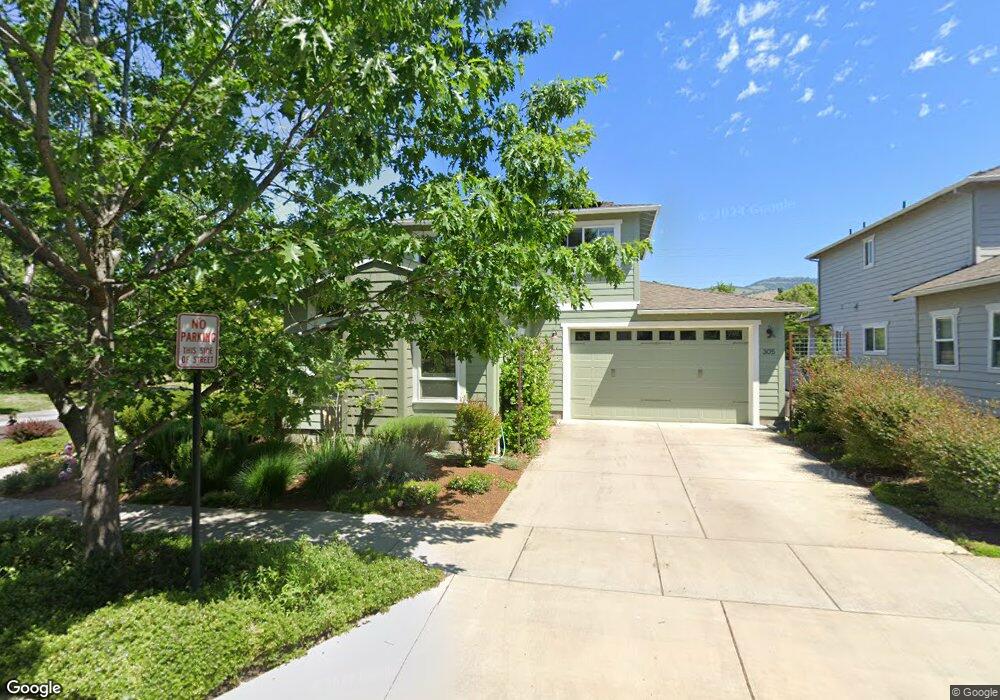
305 Stoneridge Lot 1 Ave Ashland, OR 97520
Mountain Meadows NeighborhoodEstimated Value: $497,000 - $741,000
3
Beds
2
Baths
1,721
Sq Ft
$352/Sq Ft
Est. Value
About This Home
This home is located at 305 Stoneridge Lot 1 Ave, Ashland, OR 97520 and is currently estimated at $606,232, approximately $352 per square foot. 305 Stoneridge Lot 1 Ave is a home located in Jackson County with nearby schools including Helman Elementary School, Ashland Middle School, and Ashland High School.
Ownership History
Date
Name
Owned For
Owner Type
Purchase Details
Closed on
Oct 30, 2013
Sold by
Fred Cox Company Llc
Bought by
Sullivan Susan T
Current Estimated Value
Home Financials for this Owner
Home Financials are based on the most recent Mortgage that was taken out on this home.
Original Mortgage
$135,000
Outstanding Balance
$34,630
Interest Rate
3.48%
Mortgage Type
New Conventional
Estimated Equity
$571,602
Purchase Details
Closed on
Jun 3, 2013
Sold by
Cox Fred
Bought by
Fred Cox Company Llc
Home Financials for this Owner
Home Financials are based on the most recent Mortgage that was taken out on this home.
Original Mortgage
$170,000
Interest Rate
3.37%
Mortgage Type
Purchase Money Mortgage
Purchase Details
Closed on
Aug 10, 2011
Sold by
Umpqua Bank
Bought by
Cox Fred
Home Financials for this Owner
Home Financials are based on the most recent Mortgage that was taken out on this home.
Original Mortgage
$146,000
Interest Rate
4.46%
Mortgage Type
Purchase Money Mortgage
Create a Home Valuation Report for This Property
The Home Valuation Report is an in-depth analysis detailing your home's value as well as a comparison with similar homes in the area
Home Values in the Area
Average Home Value in this Area
Purchase History
| Date | Buyer | Sale Price | Title Company |
|---|---|---|---|
| Sullivan Susan T | $370,471 | Amerititle | |
| Fred Cox Company Llc | $150,000 | Amerititle | |
| Cox Fred | $169,000 | First American |
Source: Public Records
Mortgage History
| Date | Status | Borrower | Loan Amount |
|---|---|---|---|
| Open | Sullivan Susan T | $135,000 | |
| Previous Owner | Fred Cox Company Llc | $170,000 | |
| Previous Owner | Cox Fred | $146,000 |
Source: Public Records
Tax History Compared to Growth
Tax History
| Year | Tax Paid | Tax Assessment Tax Assessment Total Assessment is a certain percentage of the fair market value that is determined by local assessors to be the total taxable value of land and additions on the property. | Land | Improvement |
|---|---|---|---|---|
| 2025 | $5,908 | $381,030 | $183,100 | $197,930 |
| 2024 | $5,908 | $369,940 | $177,770 | $192,170 |
| 2023 | $5,715 | $359,170 | $172,590 | $186,580 |
| 2022 | $5,532 | $359,170 | $172,590 | $186,580 |
| 2021 | $5,344 | $348,710 | $167,560 | $181,150 |
| 2020 | $5,193 | $338,560 | $162,690 | $175,870 |
| 2019 | $5,112 | $319,130 | $153,360 | $165,770 |
| 2018 | $4,829 | $309,840 | $148,900 | $160,940 |
| 2017 | $4,794 | $309,840 | $148,900 | $160,940 |
| 2016 | $4,669 | $292,060 | $140,350 | $151,710 |
| 2015 | $4,488 | $292,060 | $140,350 | $151,710 |
| 2014 | $4,343 | $275,310 | $132,290 | $143,020 |
Source: Public Records
Map
Nearby Homes
- 346 Stoneridge Ave
- 969 Camelot Dr
- 597 Mariposa Ct Unit 14
- 920 N Mountain Ave
- 820 Satsuma Ct Unit 6
- 833 Cobblestone Ct
- 949 Golden Aspen Place
- 969 Golden Aspen Place Unit 25
- 923 Mountain Meadows Cir Unit 12
- 955 Golden Aspen Place Unit 12
- 954 Golden Aspen Place Unit 11
- 941 Mountain Meadows Cir Unit 20
- 992 Golden Aspen Place Unit 48
- 910 Mountain Meadows Cir
- 913 Mountain Meadows Cir
- 815 Creek Stone Way
- 767 Oak St
- 224 Alicia St
- 403 Briscoe Place
- 520 Helman St
- 305 Stoneridge Ave
- 315 Stoneridge Ave
- 325 Stoneridge Ave
- 335 Stoneridge Ave
- 994 Kestrel Pkwy
- 994 Kestrel Pkwy
- 345 Stoneridge Ave
- 336 Stoneridge Lot#13 Ave
- 336 Stoneridge Ave
- 984 Kestrel Pkwy
- 355 Stoneridge Ave
- 346 Stoneridge Ave Unit Lot12
- 346 Stoneridge Lot#12 Ave
- 974 Kestrel Pkwy
- 0 Meadowbrook Park II Sub Unit 152920367
- 974 Kestrel Lot#16 Pkwy
- 365 Stoneridge Ave
- 356 Stoneridge Ave
- 366 Stoneridge Ave
- 366 Stoneridge Lot#10 Ave