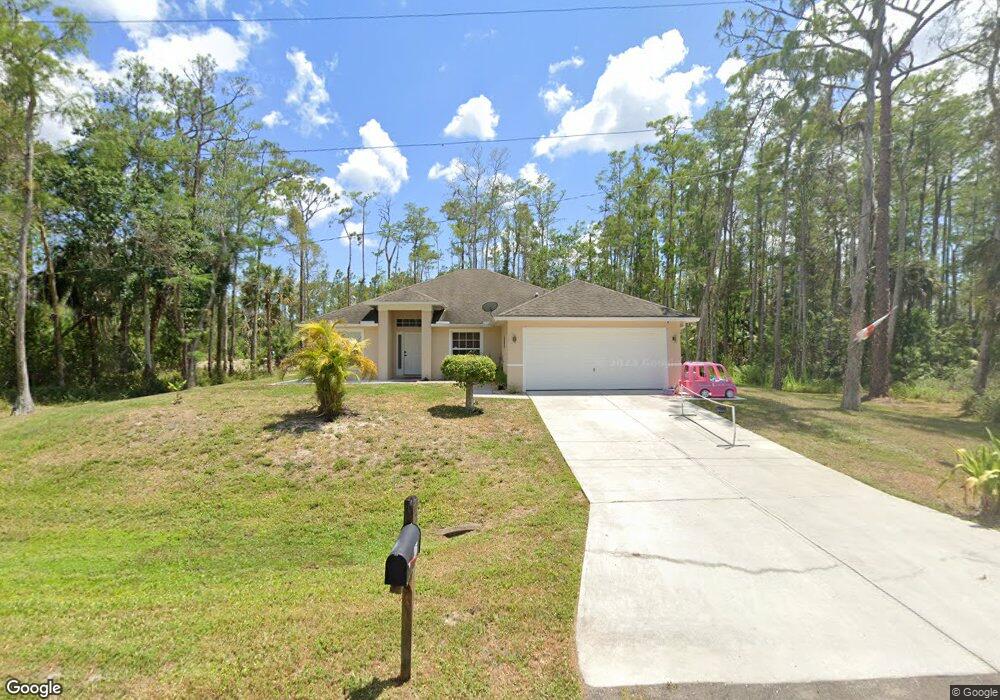
305 Vicksburg Ave Lehigh Acres, FL 33972
Joel NeighborhoodEstimated Value: $308,051 - $443,000
4
Beds
2
Baths
1,971
Sq Ft
$179/Sq Ft
Est. Value
About This Home
This home is located at 305 Vicksburg Ave, Lehigh Acres, FL 33972 and is currently estimated at $352,513, approximately $178 per square foot. 305 Vicksburg Ave is a home located in Lee County with nearby schools including The Alva School, Lehigh Elementary School, and Gateway Elementary School.
Ownership History
Date
Name
Owned For
Owner Type
Purchase Details
Closed on
Jul 30, 2009
Sold by
Shadduck Charles W
Bought by
Finn John
Current Estimated Value
Home Financials for this Owner
Home Financials are based on the most recent Mortgage that was taken out on this home.
Original Mortgage
$83,000
Interest Rate
7%
Mortgage Type
Seller Take Back
Purchase Details
Closed on
Jun 17, 2009
Sold by
Wollner John H
Bought by
Shadduck Charles W
Home Financials for this Owner
Home Financials are based on the most recent Mortgage that was taken out on this home.
Original Mortgage
$83,000
Interest Rate
7%
Mortgage Type
Seller Take Back
Purchase Details
Closed on
Aug 11, 2004
Sold by
Davis Richard F
Bought by
Eagle Construction & Development Inc
Purchase Details
Closed on
Aug 9, 2004
Sold by
Eagle Construction & Development Inc
Bought by
Wollner Md John H
Purchase Details
Closed on
Jun 30, 2004
Sold by
Weinhandl Franz and Weinhandl Julie
Bought by
Davis Richard F
Create a Home Valuation Report for This Property
The Home Valuation Report is an in-depth analysis detailing your home's value as well as a comparison with similar homes in the area
Home Values in the Area
Average Home Value in this Area
Purchase History
| Date | Buyer | Sale Price | Title Company |
|---|---|---|---|
| Finn John | $88,300 | Best Title Solutions Inc | |
| Shadduck Charles W | $65,000 | Best Title Solutions Inc | |
| Eagle Construction & Development Inc | $7,700 | Cape Coral Title Insurance A | |
| Wollner Md John H | $11,000 | Cape Coral Title Insurance A | |
| Davis Richard F | $7,700 | Cape Coral Title Insurance A |
Source: Public Records
Mortgage History
| Date | Status | Borrower | Loan Amount |
|---|---|---|---|
| Closed | Finn John | $83,000 |
Source: Public Records
Tax History Compared to Growth
Tax History
| Year | Tax Paid | Tax Assessment Tax Assessment Total Assessment is a certain percentage of the fair market value that is determined by local assessors to be the total taxable value of land and additions on the property. | Land | Improvement |
|---|---|---|---|---|
| 2025 | $1,374 | $76,168 | -- | -- |
| 2024 | $1,285 | $74,021 | -- | -- |
| 2023 | $1,285 | $71,544 | $0 | $0 |
| 2022 | $1,170 | $68,779 | $0 | $0 |
| 2021 | $1,074 | $177,227 | $7,800 | $169,427 |
| 2020 | $988 | $62,119 | $0 | $0 |
| 2019 | $1,013 | $60,722 | $0 | $0 |
| 2018 | $989 | $59,590 | $0 | $0 |
| 2017 | $953 | $58,364 | $0 | $0 |
| 2016 | $926 | $113,979 | $3,700 | $110,279 |
| 2015 | $918 | $91,396 | $2,640 | $88,756 |
| 2014 | -- | $93,002 | $2,540 | $90,462 |
| 2013 | -- | $73,401 | $1,900 | $71,501 |
Source: Public Records
Map
Nearby Homes
- 309 Stonybrook Ave
- 303 Woodburn Dr
- 308 Rosanna Ave
- 302 Rosanna Ave
- 1870 Long Beach Dr
- 302 Spokane Ave
- 300 Spokane Ave
- 323 Woodburn Dr
- 311 Woodburn Dr
- 365 Woodburn Dr
- 337 Woodburn Dr
- 249 Woodburn Dr
- 209 Woodburn Dr
- 310 Murphy Ave
- 1858 Montana St
- 1847 Montana St
- 316 Urbana St
- 1833 Lindenwood Dr
- 300 Ludlow Ave
- 1850 Tulip St
- 306 Stonybrook Ave
- 301 Vicksburg Ave
- 311 Vicksburg Ave
- 300 Stonybrook Ave
- 308 Stonybrook Ave
- 308 Vicksburg Ave Unit 15
- 306 Vicksburg Ave
- 309 Vicksburg Ave
- 304 Vicksburg Ave
- 313 Vicksburg Ave
- 312 Stonybrook Ave
- 309 Woodburn Dr
- 305 Stonybrook Ave
- 1869 Long Beach Dr
- 304 Rossana Ave
- 314 Vicksburg Ave
- 1861 Lindenwood Dr
- 310 Woodburn Dr
- 305 Rogen St
- 305 Rosanna Ave