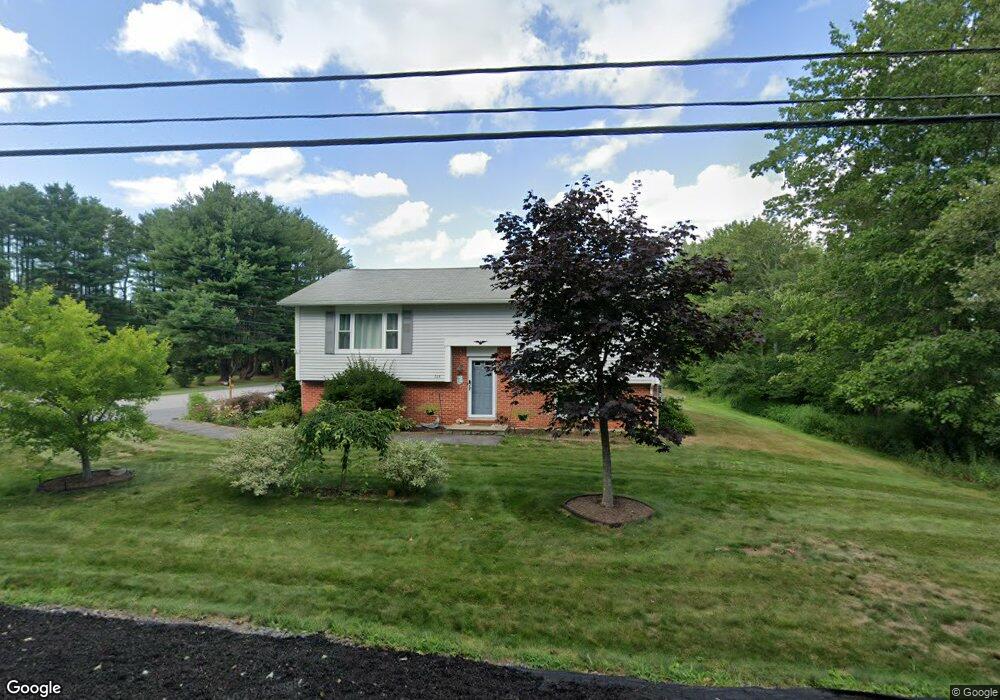
305 West St Biddeford, ME 04005
South Biddeford NeighborhoodEstimated Value: $417,000 - $464,000
3
Beds
1
Bath
1,293
Sq Ft
$339/Sq Ft
Est. Value
About This Home
This home is located at 305 West St, Biddeford, ME 04005 and is currently estimated at $438,896, approximately $339 per square foot. 305 West St is a home located in York County with nearby schools including John F Kennedy Memorial School, Biddeford Primary School, and Biddeford Intermediate School.
Ownership History
Date
Name
Owned For
Owner Type
Purchase Details
Closed on
Nov 14, 2013
Sold by
Bellerose Russell J
Bought by
Andrews Sandra L and Ford Dennis M
Current Estimated Value
Home Financials for this Owner
Home Financials are based on the most recent Mortgage that was taken out on this home.
Original Mortgage
$101,000
Outstanding Balance
$74,628
Interest Rate
4%
Mortgage Type
Adjustable Rate Mortgage/ARM
Estimated Equity
$364,268
Create a Home Valuation Report for This Property
The Home Valuation Report is an in-depth analysis detailing your home's value as well as a comparison with similar homes in the area
Home Values in the Area
Average Home Value in this Area
Purchase History
| Date | Buyer | Sale Price | Title Company |
|---|---|---|---|
| Andrews Sandra L | -- | -- |
Source: Public Records
Mortgage History
| Date | Status | Borrower | Loan Amount |
|---|---|---|---|
| Open | Andrews Sandra L | $101,000 |
Source: Public Records
Tax History Compared to Growth
Tax History
| Year | Tax Paid | Tax Assessment Tax Assessment Total Assessment is a certain percentage of the fair market value that is determined by local assessors to be the total taxable value of land and additions on the property. | Land | Improvement |
|---|---|---|---|---|
| 2024 | $4,950 | $348,100 | $167,100 | $181,000 |
| 2023 | $4,530 | $345,300 | $164,300 | $181,000 |
| 2022 | $4,140 | $252,300 | $99,600 | $152,700 |
| 2021 | $3,445 | $214,000 | $84,400 | $129,600 |
| 2020 | $2,645 | $191,900 | $73,300 | $118,600 |
| 2019 | $2,630 | $191,900 | $73,300 | $118,600 |
| 2018 | $3,780 | $191,900 | $73,300 | $118,600 |
| 2017 | $3,661 | $182,400 | $73,300 | $109,100 |
| 2016 | $3,622 | $182,400 | $73,300 | $109,100 |
| 2015 | $3,551 | $182,400 | $73,300 | $109,100 |
| 2014 | $3,857 | $203,100 | $81,600 | $121,500 |
| 2013 | -- | $204,000 | $73,300 | $130,700 |
Source: Public Records
Map
Nearby Homes