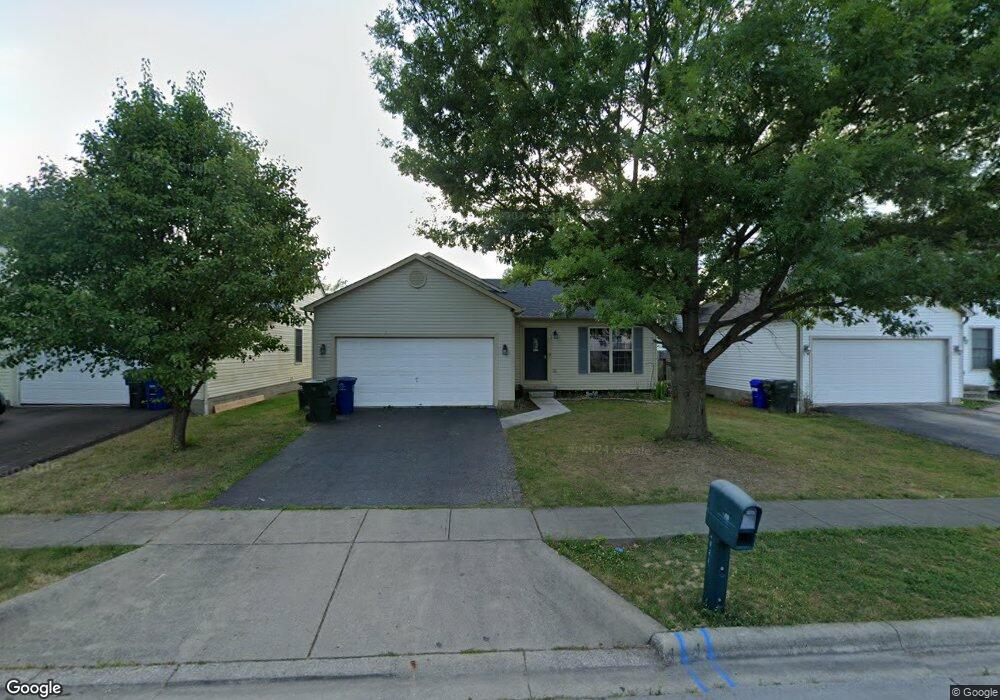
3051 Briar Ridge Rd Columbus, OH 43232
Glenbrook NeighborhoodEstimated Value: $221,000 - $284,000
3
Beds
3
Baths
1,612
Sq Ft
$161/Sq Ft
Est. Value
About This Home
This home is located at 3051 Briar Ridge Rd, Columbus, OH 43232 and is currently estimated at $258,785, approximately $160 per square foot. 3051 Briar Ridge Rd is a home located in Franklin County with nearby schools including Groveport Madison High School, Eastland Preparatory Academy, and Millennium Community School.
Ownership History
Date
Name
Owned For
Owner Type
Purchase Details
Closed on
Mar 31, 2009
Sold by
Secretary Of Housing & Urban Development
Bought by
Eichenlaub Nicole M
Current Estimated Value
Home Financials for this Owner
Home Financials are based on the most recent Mortgage that was taken out on this home.
Original Mortgage
$81,298
Outstanding Balance
$52,079
Interest Rate
5.19%
Mortgage Type
FHA
Estimated Equity
$206,706
Purchase Details
Closed on
Apr 22, 2008
Sold by
Talib Derek C and Everbank
Bought by
Secretary Of Housing & Urban Development
Purchase Details
Closed on
May 26, 1998
Sold by
Dominion Homes Inc
Bought by
Talib Derek C and Talib Stephanie L
Home Financials for this Owner
Home Financials are based on the most recent Mortgage that was taken out on this home.
Original Mortgage
$128,630
Interest Rate
7.27%
Mortgage Type
FHA
Create a Home Valuation Report for This Property
The Home Valuation Report is an in-depth analysis detailing your home's value as well as a comparison with similar homes in the area
Home Values in the Area
Average Home Value in this Area
Purchase History
| Date | Buyer | Sale Price | Title Company |
|---|---|---|---|
| Eichenlaub Nicole M | $80,000 | Real Living | |
| Secretary Of Housing & Urban Development | $90,000 | Independent | |
| Talib Derek C | $132,100 | Alliance Title |
Source: Public Records
Mortgage History
| Date | Status | Borrower | Loan Amount |
|---|---|---|---|
| Open | Eichenlaub Nicole M | $81,298 | |
| Previous Owner | Talib Derek C | $128,630 |
Source: Public Records
Tax History Compared to Growth
Tax History
| Year | Tax Paid | Tax Assessment Tax Assessment Total Assessment is a certain percentage of the fair market value that is determined by local assessors to be the total taxable value of land and additions on the property. | Land | Improvement |
|---|---|---|---|---|
| 2024 | $3,286 | $77,490 | $21,000 | $56,490 |
| 2023 | $3,255 | $77,490 | $21,000 | $56,490 |
| 2022 | $2,204 | $43,650 | $6,020 | $37,630 |
| 2021 | $2,211 | $43,650 | $6,020 | $37,630 |
| 2020 | $2,214 | $43,650 | $6,020 | $37,630 |
| 2019 | $2,021 | $35,630 | $4,830 | $30,800 |
| 2018 | $2,164 | $35,630 | $4,830 | $30,800 |
| 2017 | $2,155 | $35,630 | $4,830 | $30,800 |
| 2016 | $2,269 | $36,230 | $7,180 | $29,050 |
| 2015 | $2,294 | $36,230 | $7,180 | $29,050 |
| 2014 | $2,320 | $36,230 | $7,180 | $29,050 |
| 2013 | $1,022 | $38,150 | $7,560 | $30,590 |
Source: Public Records
Map
Nearby Homes
- 3059 Remington Ridge Rd
- 3100 Westaire Ct
- 3811 Bay Village St
- 2825 S Hampton Rd
- 3105 Wessex Ct
- 0 Wessex Ct
- 3830 Charbonnett Ct Unit 6-A
- 3365 Bruceton Ave
- 2472 Nassau Dr Unit 37D
- 2509 Burgandy Ln Unit 46B
- 2425 Mason Village Ct Unit 2425
- 2503 Burgandy Ln Unit 46A
- 4479 Gerling Blvd
- 4485 Helen Dr
- 4486 Helen Dr
- 2275 Cardston Ct
- 2252 Meridian Ct
- 4521 Helen Dr
- 4468 Reinbeau Dr
- 4496 Reinbeau Dr
- 3045 Briar Ridge Rd
- 3057 Briar Ridge Rd
- 3039 Briar Ridge Rd
- 3063 Briar Ridge Rd
- 3052 Remington Ridge Rd
- 3046 Remington Ridge Rd
- 3058 Remington Ridge Rd
- 3040 Remington Ridge Rd
- 3654 Halloran Ct
- 3033 Briar Ridge Rd
- 3069 Briar Ridge Rd
- 3064 Remington Ridge Rd
- 3653 Halloran Ct
- 3034 Remington Ridge Rd
- 3070 Remington Ridge Rd
- 3655 Roxmore Ct
- 3027 Briar Ridge Rd
- 3660 Halloran Ct
- 3075 Briar Ridge Rd
- 3028 Remington Ridge Rd