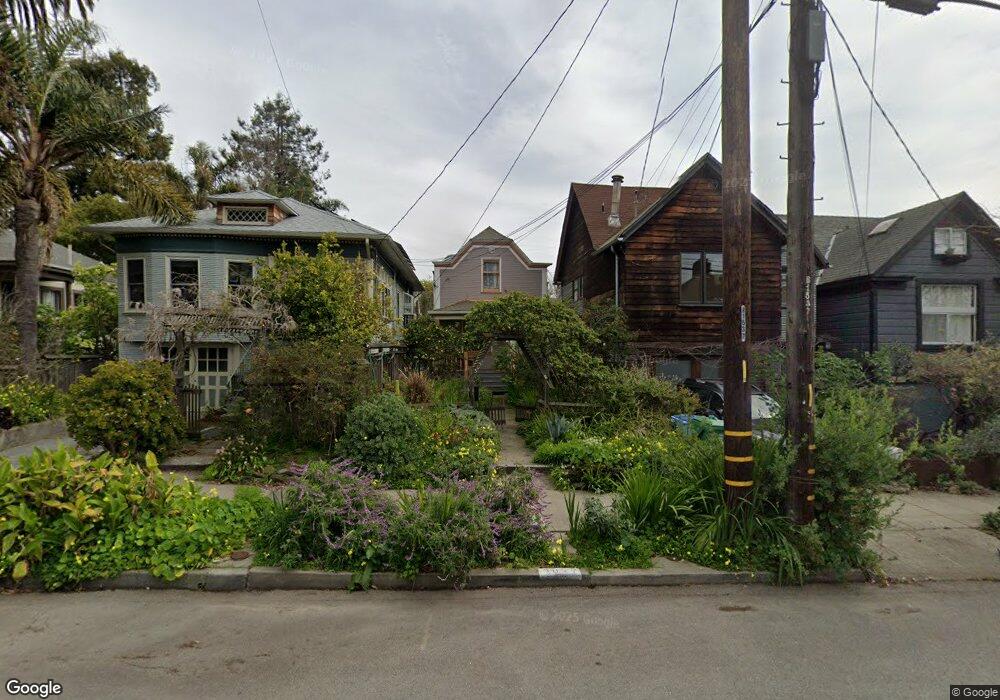
3051 Wheeler St Berkeley, CA 94705
South Berkeley NeighborhoodEstimated Value: $1,190,000 - $1,288,000
2
Beds
2
Baths
1,038
Sq Ft
$1,198/Sq Ft
Est. Value
About This Home
This home is located at 3051 Wheeler St, Berkeley, CA 94705 and is currently estimated at $1,243,777, approximately $1,198 per square foot. 3051 Wheeler St is a home located in Alameda County with nearby schools including Malcolm X Elementary School, Emerson Elementary School, and John Muir Elementary School.
Ownership History
Date
Name
Owned For
Owner Type
Purchase Details
Closed on
Aug 23, 2019
Sold by
Revocabl Greenberg Janice and Revocabl 2012 Janice Greenberg
Bought by
Gress Elizabeth
Current Estimated Value
Home Financials for this Owner
Home Financials are based on the most recent Mortgage that was taken out on this home.
Original Mortgage
$335,000
Outstanding Balance
$221,563
Interest Rate
3.8%
Mortgage Type
New Conventional
Estimated Equity
$1,022,214
Purchase Details
Closed on
Mar 30, 2012
Sold by
Greenberg Janice and Greenberg Janice H
Bought by
Revocabl Greenberg Janice and Revocabl 2012 Janice Greenberg
Purchase Details
Closed on
Mar 25, 1999
Sold by
Nicholas Sarah M
Bought by
Greenberg Janice H
Home Financials for this Owner
Home Financials are based on the most recent Mortgage that was taken out on this home.
Original Mortgage
$156,800
Interest Rate
6.79%
Create a Home Valuation Report for This Property
The Home Valuation Report is an in-depth analysis detailing your home's value as well as a comparison with similar homes in the area
Home Values in the Area
Average Home Value in this Area
Purchase History
| Date | Buyer | Sale Price | Title Company |
|---|---|---|---|
| Gress Elizabeth | $1,035,000 | Placer Title Company | |
| Revocabl Greenberg Janice | -- | None Available | |
| Greenberg Janice H | $196,000 | Old Republic Title Company |
Source: Public Records
Mortgage History
| Date | Status | Borrower | Loan Amount |
|---|---|---|---|
| Open | Gress Elizabeth | $335,000 | |
| Previous Owner | Greenberg Janice H | $156,800 |
Source: Public Records
Tax History
| Year | Tax Paid | Tax Assessment Tax Assessment Total Assessment is a certain percentage of the fair market value that is determined by local assessors to be the total taxable value of land and additions on the property. | Land | Improvement |
|---|---|---|---|---|
| 2025 | $16,001 | $1,124,906 | $339,572 | $792,334 |
| 2024 | $16,001 | $1,102,715 | $332,914 | $776,801 |
| 2023 | $15,624 | $1,087,960 | $326,388 | $761,572 |
| 2022 | $15,322 | $1,059,628 | $319,988 | $746,640 |
| 2021 | $15,471 | $1,040,121 | $313,716 | $732,005 |
| 2020 | $14,775 | $1,035,000 | $310,500 | $724,500 |
| 2019 | $5,231 | $275,440 | $82,632 | $192,808 |
| 2018 | $5,119 | $270,040 | $81,012 | $189,028 |
| 2017 | $4,920 | $264,746 | $79,424 | $185,322 |
| 2016 | $4,712 | $259,556 | $77,867 | $181,689 |
| 2015 | $4,637 | $255,657 | $76,697 | $178,960 |
| 2014 | $4,561 | $250,650 | $75,195 | $175,455 |
Source: Public Records
Map
Nearby Homes
- 3046 Deakin St
- 2923 Wheeler St
- 2124 Prince St
- 2110 Ashby Ave
- 2243 Ashby Ave
- 629 66th St
- 2057 Emerson St
- 6445 Irwin Ct
- 6555 Shattuck Ave
- 2917 Telegraph Ave
- 556 Alcatraz Ave
- 2935 Florence St
- 667 & 667A Alcatraz Ave
- 667 Alcatraz Ave
- 6320 Shattuck Ave
- 6446 Colby St
- 6300 Shattuck Ave Unit 1
- 2319 Ward St
- 2477 Prince St
- 2702 Dana St
- 3049 Wheeler St
- 3047 Wheeler St
- 3087 Wheeler St
- 3091 Wheeler St
- 3037 Wheeler St
- 2209 Prince St
- 2205 Prince St
- 3048 Fulton St
- 3046 Fulton St
- 3042 Fulton St
- 3033 Wheeler St
- 3042 Wheeler St
- 3040 Fulton St
- 3038 Fulton St
- 3054 Wheeler St
- 3052 Wheeler St
- 2139 Prince St
- 2136 Essex St
- 3031 Wheeler St
- 2137 Prince St
Your Personal Tour Guide
Ask me questions while you tour the home.