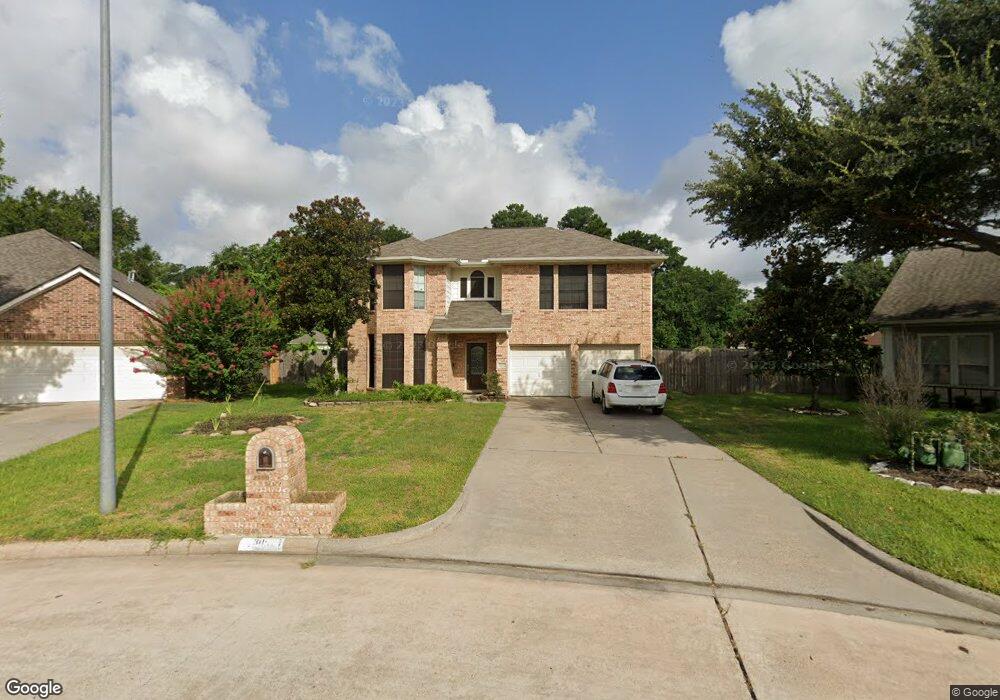
30527 Country Meadows Dr Tomball, TX 77375
Estimated Value: $338,000 - $391,000
3
Beds
3
Baths
2,400
Sq Ft
$148/Sq Ft
Est. Value
About This Home
This home is located at 30527 Country Meadows Dr, Tomball, TX 77375 and is currently estimated at $355,824, approximately $148 per square foot. 30527 Country Meadows Dr is a home located in Harris County with nearby schools including Tomball Elementary School, Tomball Intermediate School, and Tomball Junior High School.
Ownership History
Date
Name
Owned For
Owner Type
Purchase Details
Closed on
Apr 19, 2005
Sold by
Prudential Relocation Inc
Bought by
Runkel Jay C and Runkel Dawn K
Current Estimated Value
Home Financials for this Owner
Home Financials are based on the most recent Mortgage that was taken out on this home.
Original Mortgage
$94,000
Outstanding Balance
$48,948
Interest Rate
5.92%
Mortgage Type
Purchase Money Mortgage
Estimated Equity
$306,876
Purchase Details
Closed on
Dec 27, 2004
Sold by
Webb John L and Webb Danna A
Bought by
Prudential Relocation Inc
Purchase Details
Closed on
Oct 30, 1998
Sold by
Dover Homes
Bought by
Webb John L and Webb Danna A
Home Financials for this Owner
Home Financials are based on the most recent Mortgage that was taken out on this home.
Original Mortgage
$131,450
Interest Rate
6.61%
Create a Home Valuation Report for This Property
The Home Valuation Report is an in-depth analysis detailing your home's value as well as a comparison with similar homes in the area
Home Values in the Area
Average Home Value in this Area
Purchase History
| Date | Buyer | Sale Price | Title Company |
|---|---|---|---|
| Runkel Jay C | -- | Texas American Title Company | |
| Prudential Relocation Inc | -- | Texas American Title Company | |
| Webb John L | -- | Commonwealth Land Title Co |
Source: Public Records
Mortgage History
| Date | Status | Borrower | Loan Amount |
|---|---|---|---|
| Open | Runkel Jay C | $94,000 | |
| Previous Owner | Webb John L | $131,450 |
Source: Public Records
Tax History Compared to Growth
Tax History
| Year | Tax Paid | Tax Assessment Tax Assessment Total Assessment is a certain percentage of the fair market value that is determined by local assessors to be the total taxable value of land and additions on the property. | Land | Improvement |
|---|---|---|---|---|
| 2025 | $1,193 | $339,732 | $62,887 | $276,845 |
| 2024 | $1,193 | $336,928 | $61,700 | $275,228 |
| 2023 | $1,193 | $374,175 | $61,700 | $312,475 |
| 2022 | $6,269 | $324,073 | $61,700 | $262,373 |
| 2021 | $5,996 | $264,936 | $51,417 | $213,519 |
| 2020 | $5,637 | $229,832 | $41,529 | $188,303 |
| 2019 | $5,575 | $220,977 | $41,529 | $179,448 |
| 2018 | $1,335 | $210,507 | $26,895 | $183,612 |
| 2017 | $5,090 | $210,507 | $26,895 | $183,612 |
| 2016 | $4,628 | $183,643 | $26,895 | $156,748 |
| 2015 | $1,915 | $183,643 | $26,895 | $156,748 |
| 2014 | $1,915 | $174,868 | $26,895 | $147,973 |
Source: Public Records
Map
Nearby Homes
- 14134 Pollux Ct
- 1302 Pine Trail
- 14123 Spring Pines Dr
- 13303 Lost Creek Rd
- 14210 Altair Dr
- 930 Arbor Pine
- 11211 Stirton Dr
- 11235 Stirton Dr
- 1319 Pine Trail
- 31318 Bearing Star Ln
- 1310 Big Pines
- 31410 Bearing Star Ln
- 14222 Spring Pines Dr
- 31335 Bearing Star Ln
- 1315 Big Pines
- 31407 Bearing Star Ln
- 1314 Pine Brook
- 14219 Turnervine Dr
- 1126 Audrey Trail
- 31414 Helen Ln
- 30523 Country Meadows Dr
- 30531 Country Meadows Dr
- 13623 Country Ln
- 30519 Country Meadows Dr
- 30535 Country Meadows Dr
- 13619 Country Ln
- 30534 Country Meadows Dr
- 30515 Country Meadows Dr
- 30539 Country Meadows Dr
- 13615 Country Ln
- 30552 Quinn Rd
- 30538 Country Meadows Dr
- 30540 Quinn Rd
- 13630 Country Time Cir
- 30543 Country Meadows Dr
- 30511 Country Meadows Dr
- 13611 Country Ln
- 30610 Quinn Rd
- 30542 Country Meadows Dr
- 13626 Country Time Cir