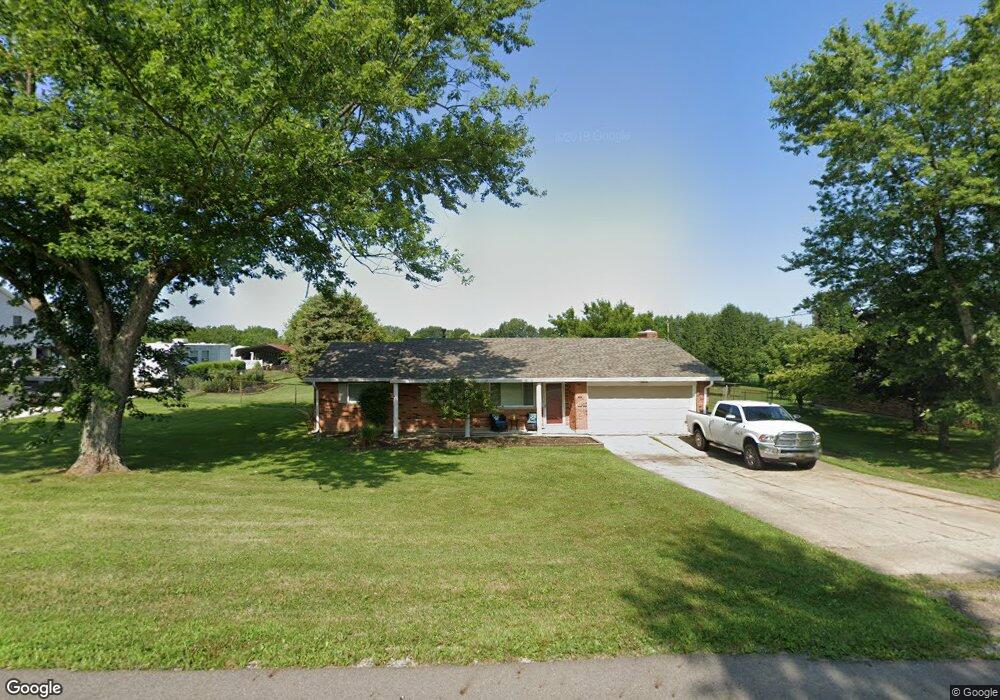
3053 Arthur Rd Springfield, OH 45502
Estimated Value: $247,000 - $272,000
3
Beds
2
Baths
1,284
Sq Ft
$202/Sq Ft
Est. Value
About This Home
This home is located at 3053 Arthur Rd, Springfield, OH 45502 and is currently estimated at $259,924, approximately $202 per square foot. 3053 Arthur Rd is a home located in Clark County with nearby schools including Greenon Elementary School, Greenon Jr. High School, and Greenon High School.
Ownership History
Date
Name
Owned For
Owner Type
Purchase Details
Closed on
Feb 3, 2012
Sold by
Aker Matthew A and Aker Tricia N
Bought by
Howard John D and Howard Ashlee N
Current Estimated Value
Home Financials for this Owner
Home Financials are based on the most recent Mortgage that was taken out on this home.
Original Mortgage
$117,657
Outstanding Balance
$79,664
Interest Rate
3.95%
Mortgage Type
VA
Estimated Equity
$180,260
Purchase Details
Closed on
Mar 29, 2007
Sold by
Gorski Michael J and Gorski Janet M
Bought by
Aker Matthew A and Aker Tricia N
Home Financials for this Owner
Home Financials are based on the most recent Mortgage that was taken out on this home.
Original Mortgage
$114,900
Interest Rate
6.2%
Mortgage Type
Purchase Money Mortgage
Purchase Details
Closed on
Nov 19, 1999
Sold by
Barker Timothy T and Barker Julie L
Bought by
Gorski Michael J and Gorski Janet M
Home Financials for this Owner
Home Financials are based on the most recent Mortgage that was taken out on this home.
Original Mortgage
$95,200
Interest Rate
7.88%
Mortgage Type
Purchase Money Mortgage
Purchase Details
Closed on
Mar 31, 1999
Sold by
Collins Margaret Ann
Bought by
Barker Timothy T and Barker Julie L
Create a Home Valuation Report for This Property
The Home Valuation Report is an in-depth analysis detailing your home's value as well as a comparison with similar homes in the area
Purchase History
| Date | Buyer | Sale Price | Title Company |
|---|---|---|---|
| Howard John D | $114,900 | Home Site Title Agency | |
| Aker Matthew A | $124,900 | Attorney | |
| Gorski Michael J | $119,000 | -- | |
| Barker Timothy T | $63,000 | -- |
Source: Public Records
Mortgage History
| Date | Status | Borrower | Loan Amount |
|---|---|---|---|
| Open | Howard John D | $117,657 | |
| Closed | Aker Matthew A | $114,900 | |
| Closed | Gorski Michael J | $95,200 |
Source: Public Records
Tax History
| Year | Tax Paid | Tax Assessment Tax Assessment Total Assessment is a certain percentage of the fair market value that is determined by local assessors to be the total taxable value of land and additions on the property. | Land | Improvement |
|---|---|---|---|---|
| 2025 | $3,262 | $77,190 | $14,520 | $62,670 |
| 2024 | $3,185 | $60,900 | $13,100 | $47,800 |
| 2023 | $3,185 | $60,900 | $13,100 | $47,800 |
| 2022 | $3,182 | $60,900 | $13,100 | $47,800 |
| 2021 | $2,610 | $44,280 | $9,490 | $34,790 |
| 2020 | $2,616 | $44,280 | $9,490 | $34,790 |
| 2019 | $2,652 | $44,280 | $9,490 | $34,790 |
| 2018 | $2,668 | $43,560 | $8,700 | $34,860 |
| 2017 | $2,675 | $43,561 | $8,701 | $34,860 |
| 2016 | $2,331 | $43,561 | $8,701 | $34,860 |
| 2015 | $2,171 | $39,102 | $7,910 | $31,192 |
| 2014 | $2,175 | $39,102 | $7,910 | $31,192 |
| 2013 | $1,913 | $39,102 | $7,910 | $31,192 |
Source: Public Records
Map
Nearby Homes
- 1290 Red Oaks Cir
- 3319 Wendover St
- 124 Old Mill Rd
- 0 Upper Valley Pike
- 190 Oakridge Dr
- 1109 Montgomery Ave
- 1915 W Washington St
- 110 Walter St
- 106 Walter St
- 2301 Duquesne Dr
- 1618 W Pleasant St
- 0 Montgomery Ave
- 1828 W Washington St
- 1906-1908 W High St
- 3891 New Carlisle Pike
- 202 Seever St
- 624 Aberfelda Dr
- 3190 Rebert Pike
- 2140 Shawnee Ave
- 00 Russell Ave
- 3021 Arthur Rd
- 3065 Arthur Rd
- 3022 Arthur Rd
- 2995 Arthur Rd
- 3075 Arthur Rd
- 3036 Arthur Rd
- 3070 Arthur Rd
- 3010 Arthur Rd
- 2994 Arthur Rd
- 3082 Arthur Rd
- 3054 Arthur Rd
- 2981 Arthur Rd
- 3091 Arthur Rd
- 2976 Arthur Rd
- 2965 Arthur Rd
- 2887 Dayton Rd
- 2887 Dayton Springfield Rd
- 2871 Dayton Rd
- 2843 Dayton Rd
- 2961 Arthur Rd
Your Personal Tour Guide
Ask me questions while you tour the home.