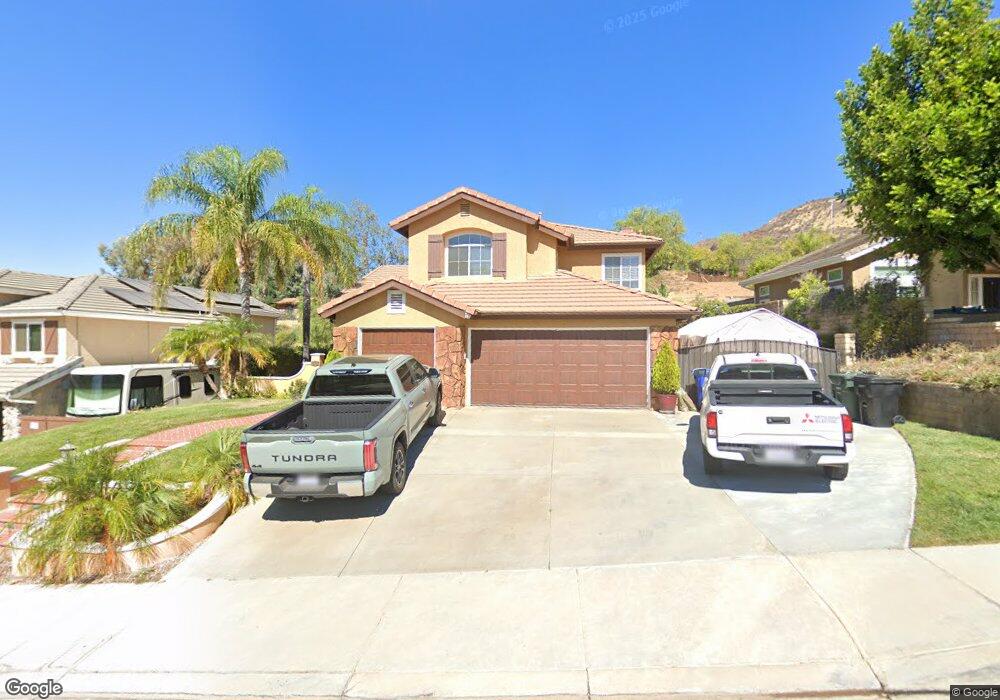
30535 Yucca Place Castaic, CA 91384
Estimated Value: $868,000 - $911,000
5
Beds
3
Baths
2,200
Sq Ft
$403/Sq Ft
Est. Value
About This Home
This home is located at 30535 Yucca Place, Castaic, CA 91384 and is currently estimated at $887,112, approximately $403 per square foot. 30535 Yucca Place is a home located in Los Angeles County with nearby schools including Castaic Elementary School, Castaic Middle School, and Valencia High School.
Ownership History
Date
Name
Owned For
Owner Type
Purchase Details
Closed on
Mar 28, 2019
Sold by
Fry James and Fry Cheryl
Bought by
Fry James R and Fry Grace B
Current Estimated Value
Home Financials for this Owner
Home Financials are based on the most recent Mortgage that was taken out on this home.
Original Mortgage
$611,100
Outstanding Balance
$537,266
Interest Rate
4.3%
Mortgage Type
New Conventional
Estimated Equity
$349,846
Purchase Details
Closed on
May 22, 2001
Sold by
Roughen Christopher M and Roughen Laura L
Bought by
Fry James and Fry Cheryl
Home Financials for this Owner
Home Financials are based on the most recent Mortgage that was taken out on this home.
Original Mortgage
$254,000
Interest Rate
7.26%
Create a Home Valuation Report for This Property
The Home Valuation Report is an in-depth analysis detailing your home's value as well as a comparison with similar homes in the area
Home Values in the Area
Average Home Value in this Area
Purchase History
| Date | Buyer | Sale Price | Title Company |
|---|---|---|---|
| Fry James R | $679,000 | Ticor Title | |
| Fry James | $318,000 | Commonwealth Title |
Source: Public Records
Mortgage History
| Date | Status | Borrower | Loan Amount |
|---|---|---|---|
| Open | Fry James R | $611,100 | |
| Previous Owner | Fry James | $254,000 | |
| Closed | Fry James | $47,625 |
Source: Public Records
Tax History Compared to Growth
Tax History
| Year | Tax Paid | Tax Assessment Tax Assessment Total Assessment is a certain percentage of the fair market value that is determined by local assessors to be the total taxable value of land and additions on the property. | Land | Improvement |
|---|---|---|---|---|
| 2025 | $7,315 | $469,021 | $186,128 | $282,893 |
| 2024 | $7,315 | $459,826 | $182,479 | $277,347 |
| 2023 | $6,963 | $450,810 | $178,901 | $271,909 |
| 2022 | $6,817 | $441,972 | $175,394 | $266,578 |
| 2021 | $9,782 | $699,755 | $312,571 | $387,184 |
| 2019 | $3,304 | $420,455 | $166,855 | $253,600 |
| 2018 | $6,613 | $412,212 | $163,584 | $248,628 |
| 2016 | $5,699 | $396,207 | $157,233 | $238,974 |
| 2015 | $5,649 | $390,257 | $154,872 | $235,385 |
| 2014 | $5,570 | $382,614 | $151,839 | $230,775 |
Source: Public Records
Map
Nearby Homes
- 30311 Ashfield Ct Unit 67
- 28204 Cascade Rd
- 27631 Iris Place
- 27740 Elkwood Ln
- 27732 Elkwood Ln
- 27626 Iris Place
- 27623 Morning Glory Place
- 30321 June Rose Ct
- 30444 Beryl Place
- 30118 Galbreth Ct
- 30566 Beryl Place
- 30160 Holmby Ct
- 28725 Ponderosa St
- 30103 Desert Rose Dr
- 27625 Moonlight Place
- 28720 Red Rock Ct
- 30411 Vineyard Ln
- 27962 Bridlewood Dr
- 27922 Bridlewood Dr
- 28410 Orange Park Dr
- 30543 Yucca Place
- 30529 Yucca Place
- 30549 Yucca Place
- 30523 Yucca Place
- 28002 Minaret Ct
- 28006 Minaret Ct
- 27968 Glade Ct
- 27967 Glade Ct
- 30557 Yucca Place
- 30517 Yucca Place
- 30520 Yucca Place
- 27963 Glade Ct
- 30554 Yucca Place
- 30513 Yucca Place
- 30563 Yucca Place
- 30520 Yosemite Dr
- 28016 Minaret Ct
- 30514 Yucca Place
- 27960 Glade Ct
- 30528 Yosemite Dr