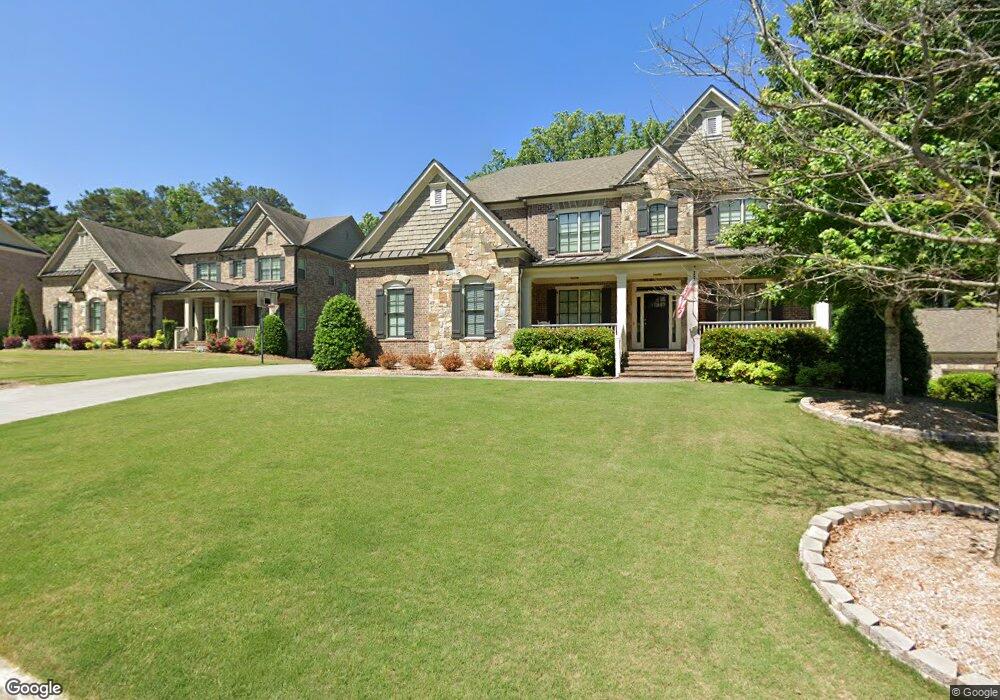
3055 Post Oak Tritt Rd Marietta, GA 30062
East Cobb NeighborhoodEstimated Value: $987,000 - $1,490,000
5
Beds
5
Baths
4,254
Sq Ft
$305/Sq Ft
Est. Value
About This Home
This home is located at 3055 Post Oak Tritt Rd, Marietta, GA 30062 and is currently estimated at $1,297,259, approximately $304 per square foot. 3055 Post Oak Tritt Rd is a home located in Cobb County with nearby schools including Murdock Elementary School, Hightower Trail Middle School, and Pope High School.
Ownership History
Date
Name
Owned For
Owner Type
Purchase Details
Closed on
Apr 14, 2016
Sold by
Holt Builders Llc
Bought by
Suthar Tushar N and Suthar Samantha D
Current Estimated Value
Home Financials for this Owner
Home Financials are based on the most recent Mortgage that was taken out on this home.
Original Mortgage
$634,429
Outstanding Balance
$490,854
Interest Rate
2.99%
Mortgage Type
New Conventional
Estimated Equity
$806,405
Purchase Details
Closed on
Nov 24, 2014
Sold by
Holt Development Llc
Bought by
Holt Builders Llc
Purchase Details
Closed on
Feb 28, 2013
Sold by
Sullivan Samuel Larry
Bought by
Holt Development Llc
Home Financials for this Owner
Home Financials are based on the most recent Mortgage that was taken out on this home.
Original Mortgage
$1,400,000
Interest Rate
3.56%
Mortgage Type
New Conventional
Create a Home Valuation Report for This Property
The Home Valuation Report is an in-depth analysis detailing your home's value as well as a comparison with similar homes in the area
Home Values in the Area
Average Home Value in this Area
Purchase History
| Date | Buyer | Sale Price | Title Company |
|---|---|---|---|
| Suthar Tushar N | $705,000 | -- | |
| Holt Builders Llc | $350,000 | -- | |
| Holt Development Llc | $775,000 | -- |
Source: Public Records
Mortgage History
| Date | Status | Borrower | Loan Amount |
|---|---|---|---|
| Open | Suthar Tushar N | $634,429 | |
| Previous Owner | Holt Development Llc | $1,400,000 |
Source: Public Records
Tax History Compared to Growth
Tax History
| Year | Tax Paid | Tax Assessment Tax Assessment Total Assessment is a certain percentage of the fair market value that is determined by local assessors to be the total taxable value of land and additions on the property. | Land | Improvement |
|---|---|---|---|---|
| 2025 | $11,929 | $453,480 | $110,000 | $343,480 |
| 2024 | $10,684 | $395,664 | $90,000 | $305,664 |
| 2023 | $10,141 | $395,664 | $90,000 | $305,664 |
| 2022 | $10,761 | $395,664 | $90,000 | $305,664 |
| 2021 | $9,221 | $325,304 | $86,000 | $239,304 |
| 2020 | $9,221 | $325,304 | $86,000 | $239,304 |
| 2019 | $8,241 | $280,548 | $80,000 | $200,548 |
| 2018 | $8,241 | $280,548 | $80,000 | $200,548 |
| 2017 | $7,809 | $280,548 | $80,000 | $200,548 |
| 2016 | $8,066 | $280,548 | $80,000 | $200,548 |
| 2015 | $884 | $30,000 | $30,000 | $0 |
| 2014 | $891 | $30,000 | $0 | $0 |
Source: Public Records
Map
Nearby Homes
- 3091 Branford Ct
- 2260 Falkirk Pointe Dr
- 3237 Harvest Way
- 3287 Harvest Way
- 3297 Post Oak Tritt Rd
- 2735 Wendy Ln
- 2864 Saint Andrews Way NE
- 3152 Normandy Cir NE
- 2607 Lulworth Ln
- 2760 Hembree Rd NE
- 2934 Wendover St
- 2726 Riderwood Ln NE
- 2510 Camelot Cir
- 2570 Rocky Springs Dr
- 2186 Cedar Forks Dr
- 2998 Kodiak Ct
- 2581 Weeping Oak Trace
- 2577 Weeping Oak Trace
- 2585 Weeping Oak Trace Unit 9
- 2585 Weeping Oak Trace
- 2582 Weeping Oak Trace
- 2578 Weeping Oak Trace
- 2573 Weeping Oak Trace
- 2570 Weeping Oak Trace
- 2569 Weeping Oak Trace Unit 5
- 2569 Weeping Oak Trace
- 2588 Weeping Oak Trace Unit 12
- 2588 Weeping Oak Trace
- 2558 Greyfield Ct NE
- 2560 Greyfield Ct NE
- 2589 Weeping Oak Trace
- 2562 Greyfield Ct NE
- 2556 Greyfield Ct NE
- 2564 Greyfield Ct NE
- 2593 Weeping Oak Trace
- 0 Weeping Oak Trace Unit 8807963