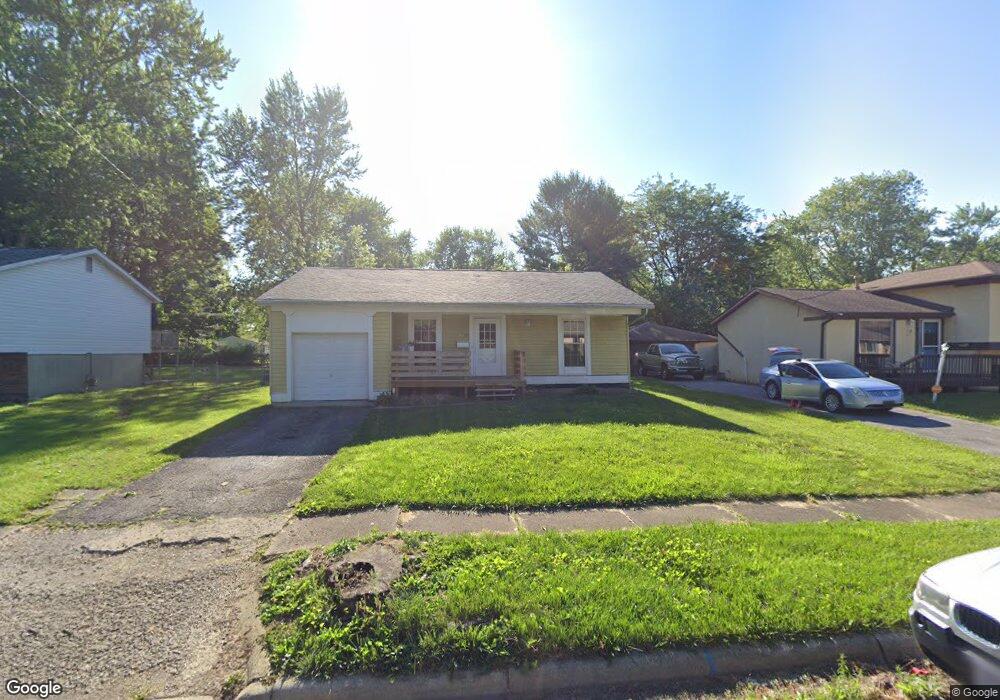
3055 Whitlow Rd Columbus, OH 43232
East Columbus-White Ash NeighborhoodEstimated Value: $195,000 - $229,000
4
Beds
2
Baths
1,088
Sq Ft
$194/Sq Ft
Est. Value
About This Home
This home is located at 3055 Whitlow Rd, Columbus, OH 43232 and is currently estimated at $211,245, approximately $194 per square foot. 3055 Whitlow Rd is a home located in Franklin County with nearby schools including Groveport Madison High School, A+ Arts Academy, and Eastland Preparatory Academy.
Ownership History
Date
Name
Owned For
Owner Type
Purchase Details
Closed on
Jun 30, 2005
Sold by
Denmark Paul S
Bought by
Walker Keith P
Current Estimated Value
Home Financials for this Owner
Home Financials are based on the most recent Mortgage that was taken out on this home.
Original Mortgage
$77,400
Outstanding Balance
$39,448
Interest Rate
5.69%
Mortgage Type
Fannie Mae Freddie Mac
Estimated Equity
$171,797
Purchase Details
Closed on
Mar 11, 2005
Sold by
Hud
Bought by
Denmark Paul S
Purchase Details
Closed on
Jun 25, 2004
Sold by
Stover Craig and Chase Manhattan Mortgage Corp
Bought by
Hud
Purchase Details
Closed on
Jun 28, 1988
Bought by
Stover Craig
Create a Home Valuation Report for This Property
The Home Valuation Report is an in-depth analysis detailing your home's value as well as a comparison with similar homes in the area
Home Values in the Area
Average Home Value in this Area
Purchase History
| Date | Buyer | Sale Price | Title Company |
|---|---|---|---|
| Walker Keith P | $86,000 | Talon Group | |
| Denmark Paul S | $62,600 | -- | |
| Hud | $70,000 | -- | |
| Stover Craig | $52,000 | -- |
Source: Public Records
Mortgage History
| Date | Status | Borrower | Loan Amount |
|---|---|---|---|
| Open | Walker Keith P | $77,400 |
Source: Public Records
Tax History
| Year | Tax Paid | Tax Assessment Tax Assessment Total Assessment is a certain percentage of the fair market value that is determined by local assessors to be the total taxable value of land and additions on the property. | Land | Improvement |
|---|---|---|---|---|
| 2025 | $3,093 | $59,820 | $17,820 | $42,000 |
| 2024 | $3,093 | $59,820 | $17,820 | $42,000 |
| 2023 | $2,967 | $59,815 | $17,815 | $42,000 |
| 2022 | $2,057 | $32,520 | $6,300 | $26,220 |
| 2021 | $2,065 | $32,520 | $6,300 | $26,220 |
| 2020 | $2,093 | $32,520 | $6,300 | $26,220 |
| 2019 | $1,896 | $27,230 | $5,250 | $21,980 |
| 2018 | $1,918 | $27,230 | $5,250 | $21,980 |
| 2017 | $1,943 | $27,230 | $5,250 | $21,980 |
| 2016 | $1,974 | $25,480 | $4,340 | $21,140 |
| 2015 | $1,928 | $25,480 | $4,340 | $21,140 |
| 2014 | $1,946 | $25,480 | $4,340 | $21,140 |
| 2013 | $929 | $28,315 | $4,830 | $23,485 |
Source: Public Records
Map
Nearby Homes
- 2998 Osgood Rd E
- 5361 Parkline Dr
- 5290 Quincy Dr
- 3012 Argonne Ct
- 2900 Gentry Ln
- 5422 Everson Rd N
- 5143 Rutledge Dr N
- 2908 Renfro Rd
- 5326 Adderley Ave
- 5185 Rutledge Dr S
- 5145 Rutledge Dr S
- 5137 Holbrook Dr
- 3246 Latonia Rd
- 4942 Talbert Dr
- 5226 Lindora Dr
- 5691 Matuka Dr
- 5373 Deforest Dr
- 2651 Brownfield Rd
- 2627 Hubbell Rd
- 4915 Kresge Dr
- 3047 Whitlow Rd
- 3063 Whitlow Rd
- 3041 Whitlow Rd
- 3054 Osgood Rd E
- 3069 Whitlow Rd
- 3046 Osgood Rd E
- 3032 Osgood Rd E
- 3058 Whitlow Rd
- 3050 Whitlow Rd
- 3033 Whitlow Rd
- 3066 Whitlow Rd
- 3075 Whitlow Rd
- 5311 Osgood Rd S
- 3042 Whitlow Rd
- 3030 Osgood Rd E
- 3074 Whitlow Rd
- 5356 Parkline Dr
- 3038 Whitlow Rd
- 3025 Whitlow Rd
- 5350 Parkline Dr
Your Personal Tour Guide
Ask me questions while you tour the home.