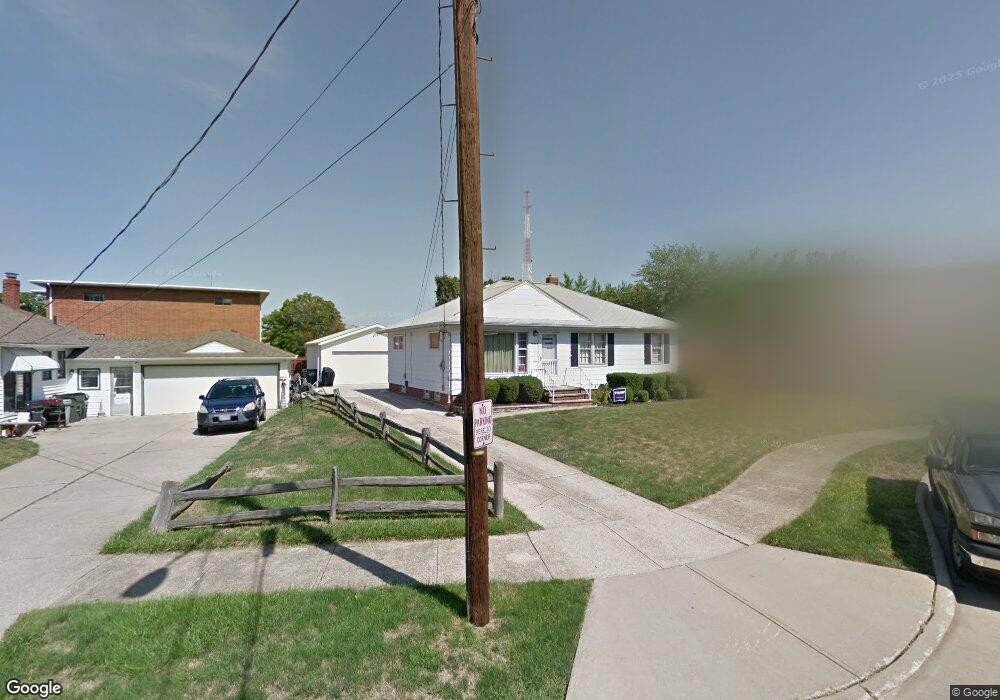
30553 Bonnie Ct Wickliffe, OH 44092
Estimated Value: $196,000 - $212,000
3
Beds
1
Bath
1,064
Sq Ft
$190/Sq Ft
Est. Value
About This Home
This home is located at 30553 Bonnie Ct, Wickliffe, OH 44092 and is currently estimated at $202,151, approximately $189 per square foot. 30553 Bonnie Ct is a home located in Lake County with nearby schools including Wickliffe Elementary School, Wickliffe Middle School, and Wickliffe High School.
Ownership History
Date
Name
Owned For
Owner Type
Purchase Details
Closed on
Nov 18, 2021
Sold by
Leben Brian J
Bought by
Sturkie Adam
Current Estimated Value
Home Financials for this Owner
Home Financials are based on the most recent Mortgage that was taken out on this home.
Original Mortgage
$156,750
Outstanding Balance
$143,634
Interest Rate
2.99%
Mortgage Type
New Conventional
Estimated Equity
$58,517
Purchase Details
Closed on
Oct 19, 2009
Sold by
Walsh James L and Walsh Pauline
Bought by
Leben Brian J
Home Financials for this Owner
Home Financials are based on the most recent Mortgage that was taken out on this home.
Original Mortgage
$80,484
Interest Rate
5.15%
Mortgage Type
FHA
Purchase Details
Closed on
Jan 1, 1990
Bought by
Walsh James L
Create a Home Valuation Report for This Property
The Home Valuation Report is an in-depth analysis detailing your home's value as well as a comparison with similar homes in the area
Home Values in the Area
Average Home Value in this Area
Purchase History
| Date | Buyer | Sale Price | Title Company |
|---|---|---|---|
| Sturkie Adam | $165,000 | Infinity Title | |
| Leben Brian J | $82,000 | Emerald Glen Title Agency | |
| Walsh James L | -- | -- |
Source: Public Records
Mortgage History
| Date | Status | Borrower | Loan Amount |
|---|---|---|---|
| Open | Sturkie Adam | $156,750 | |
| Previous Owner | Leben Brian J | $80,484 |
Source: Public Records
Tax History Compared to Growth
Tax History
| Year | Tax Paid | Tax Assessment Tax Assessment Total Assessment is a certain percentage of the fair market value that is determined by local assessors to be the total taxable value of land and additions on the property. | Land | Improvement |
|---|---|---|---|---|
| 2024 | -- | $59,940 | $16,080 | $43,860 |
| 2023 | $5,422 | $44,090 | $13,930 | $30,160 |
| 2022 | $3,163 | $44,090 | $13,930 | $30,160 |
| 2021 | $3,175 | $44,090 | $13,930 | $30,160 |
| 2020 | $2,990 | $35,270 | $11,140 | $24,130 |
| 2019 | $2,989 | $35,270 | $11,140 | $24,130 |
| 2018 | $2,585 | $38,580 | $13,990 | $24,590 |
| 2017 | $2,719 | $38,580 | $13,990 | $24,590 |
| 2016 | $2,706 | $38,580 | $13,990 | $24,590 |
| 2015 | $2,658 | $38,580 | $13,990 | $24,590 |
| 2014 | $2,342 | $38,580 | $13,990 | $24,590 |
| 2013 | $2,341 | $38,580 | $13,990 | $24,590 |
Source: Public Records
Map
Nearby Homes
- 1590 Dennis Dr
- 30335 Euclid Ave Unit 7
- 30335 Euclid Ave Unit 50
- 30530 Grant St
- 1711 Rush Rd
- 1648 Douglas Rd
- 1737 Drenik Dr
- 1560 Douglas Rd
- 34345 Giovanni Ave
- 1569 Douglas Rd
- 5218 Liberty Ln Unit A
- 5131 Liberty Ln Unit B
- 1842 Eldon Dr
- 1847 Eldon Dr
- 5510 Wildwood Ct Unit 81-A
- 30402 Forestgrove Rd
- 5084 Shepherds Glen
- 1719 E 300th St
- 5082 Shepherds Glen
- 5080 Shepherds Glen
- 1543 Rush Rd
- 30557 Bonnie Ct
- 30561 Bonnie Ct
- 1555 Rush Rd
- 1546 Severn Ln
- 1544 Severn Ln
- 1561 Rush Rd
- 1542 Severn Ln
- 1540 Severn Ln
- 1548 Severn Ln
- 1550 Severn Ln
- 1538 Severn Ln Unit 5B
- 30550 Bonnie Ct
- 30564 Bonnie Ct
- 1536 Severn Ln Unit 5A
- 1554 Severn Ln Unit 7A
- 30558 Bonnie Ct
- 1556 Severn Ln
- 1532 Severn Ln Unit 3H
- 1558 Severn Ln