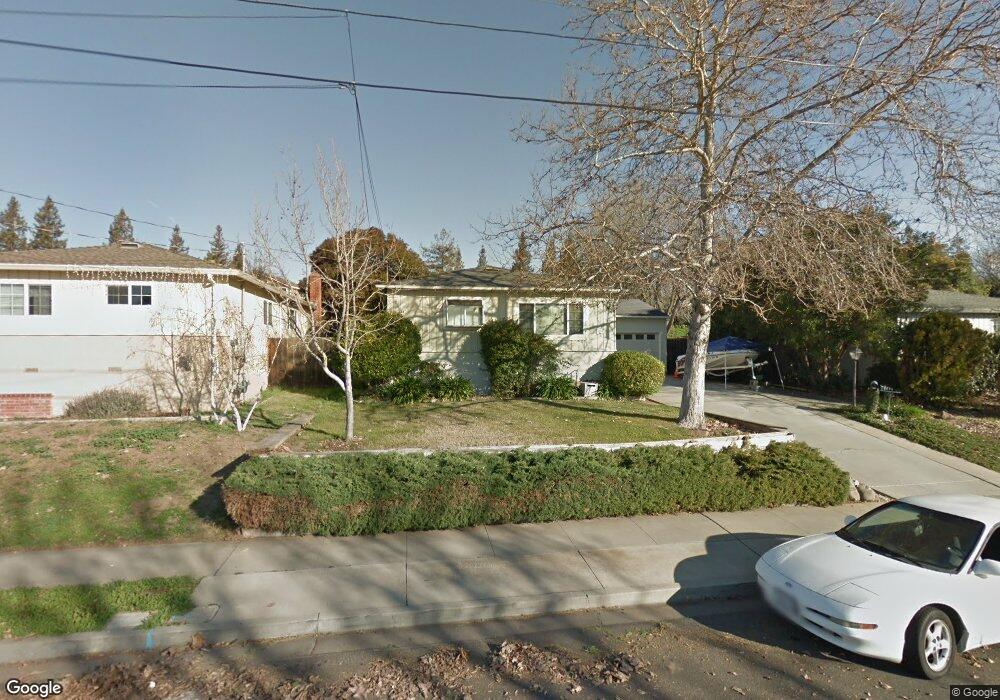
3056 Kennedy St Livermore, CA 94551
Portola Glen NeighborhoodEstimated Value: $860,000 - $916,000
3
Beds
2
Baths
1,300
Sq Ft
$685/Sq Ft
Est. Value
About This Home
This home is located at 3056 Kennedy St, Livermore, CA 94551 and is currently estimated at $890,323, approximately $684 per square foot. 3056 Kennedy St is a home located in Alameda County with nearby schools including Junction Avenue K-8 School, Livermore High School, and Valley Montessori School.
Ownership History
Date
Name
Owned For
Owner Type
Purchase Details
Closed on
Aug 10, 2023
Sold by
Diversified Residential Value Fund Llc
Bought by
Rittmann Evan M and Rittmann Lorie A
Current Estimated Value
Purchase Details
Closed on
Apr 23, 2021
Sold by
Rittmann Evan M and Rittmann Lorie A
Bought by
Rittmann Evan M and Rittmann Lorie A
Purchase Details
Closed on
Jul 20, 1999
Sold by
Rittmann Brian D and Rittmann Brandi L
Bought by
Rittman Van M and Rittman Lorie A
Home Financials for this Owner
Home Financials are based on the most recent Mortgage that was taken out on this home.
Original Mortgage
$178,000
Interest Rate
7.64%
Mortgage Type
Balloon
Purchase Details
Closed on
Mar 19, 1998
Sold by
Norris Rodney A and Norris Brenda G
Bought by
Rittmann Evan M and Rittmann Lorie A
Home Financials for this Owner
Home Financials are based on the most recent Mortgage that was taken out on this home.
Original Mortgage
$150,400
Interest Rate
7.06%
Mortgage Type
Balloon
Create a Home Valuation Report for This Property
The Home Valuation Report is an in-depth analysis detailing your home's value as well as a comparison with similar homes in the area
Home Values in the Area
Average Home Value in this Area
Purchase History
| Date | Buyer | Sale Price | Title Company |
|---|---|---|---|
| Rittmann Evan M | -- | None Listed On Document | |
| Rittmann Evan M | -- | None Available | |
| Rittman Van M | $27,000 | Fidelity National Title Co | |
| Rittmann Evan M | $188,000 | Fidelity National Title Co |
Source: Public Records
Mortgage History
| Date | Status | Borrower | Loan Amount |
|---|---|---|---|
| Previous Owner | Rittman Van M | $178,000 | |
| Previous Owner | Rittmann Evan M | $150,400 | |
| Closed | Rittmann Evan M | $18,800 |
Source: Public Records
Tax History Compared to Growth
Tax History
| Year | Tax Paid | Tax Assessment Tax Assessment Total Assessment is a certain percentage of the fair market value that is determined by local assessors to be the total taxable value of land and additions on the property. | Land | Improvement |
|---|---|---|---|---|
| 2025 | $4,408 | $293,173 | $90,052 | $210,121 |
| 2024 | $4,408 | $287,288 | $88,286 | $206,002 |
| 2023 | $4,326 | $288,518 | $86,555 | $201,963 |
| 2022 | $4,248 | $275,862 | $84,858 | $198,004 |
| 2021 | $3,407 | $270,316 | $83,195 | $194,121 |
| 2020 | $4,015 | $274,474 | $82,342 | $192,132 |
| 2019 | $4,019 | $269,093 | $80,728 | $188,365 |
| 2018 | $3,918 | $263,817 | $79,145 | $184,672 |
| 2017 | $3,806 | $258,645 | $77,593 | $181,052 |
| 2016 | $3,647 | $253,575 | $76,072 | $177,503 |
| 2015 | $3,430 | $249,767 | $74,930 | $174,837 |
| 2014 | $3,365 | $244,874 | $73,462 | $171,412 |
Source: Public Records
Map
Nearby Homes
- 2845 Briarwood Dr
- 513 Briarwood Ct
- 3370 Gardella Plaza
- 3473 Edinburgh Dr
- 2908 Worthing Common
- 3713 First St
- 3971 Portola Common Unit 1
- 2878 4th St Unit 1401
- 3491 Madeira Way
- 385 Kensington Common
- 2145 Linden St
- 2151 Elm St
- 0 N K St
- 2542 Fourth St
- 3973 Duke Way
- 3959 Purdue Way
- 202 Sonia Way
- 3283 East Ave
- 161 N L St Unit 101
- 1935 Pine St
- 3076 Kennedy St
- 3036 Kennedy St
- 3016 Kennedy St
- 3120 Kennedy St
- 3008 Kennedy St
- 3055 Kennedy St
- 3140 Kennedy St
- 3041 Kennedy St
- 3021 Kennedy St
- 3125 Kennedy St
- 3160 Kennedy St
- 3189 Salisbury Ct
- 2988 Kennedy St
- 3125 Salisbury Ct
- 363 Clarke Ave
- 3145 Kennedy St
- 368 Lee Ave
- 364 Clarke Ave
- 3209 Edinburgh Dr
- 3180 Kennedy St