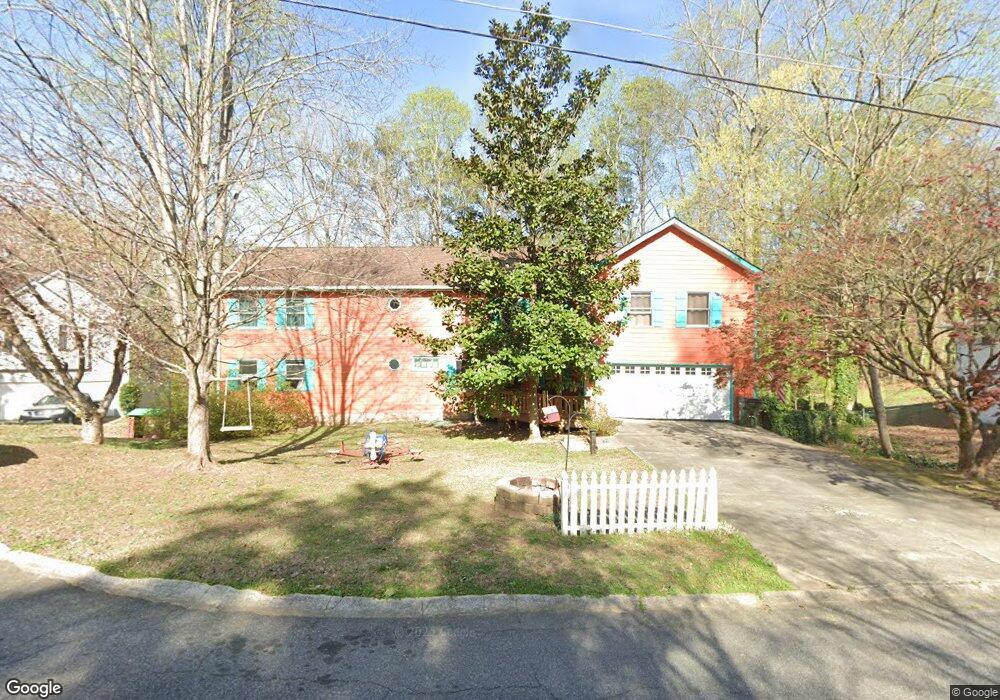
3057 Brownmoore Dr SW Marietta, GA 30060
Southwestern Marietta NeighborhoodEstimated Value: $517,767 - $583,000
5
Beds
6
Baths
4,100
Sq Ft
$135/Sq Ft
Est. Value
About This Home
This home is located at 3057 Brownmoore Dr SW, Marietta, GA 30060 and is currently estimated at $553,192, approximately $134 per square foot. 3057 Brownmoore Dr SW is a home located in Cobb County with nearby schools including Birney Elementary School, Floyd Middle School, and Osborne High School.
Ownership History
Date
Name
Owned For
Owner Type
Purchase Details
Closed on
Oct 24, 2023
Sold by
Hague Ardeen L
Bought by
Chuck & Ardeen Hague Family Trust and Hague
Current Estimated Value
Purchase Details
Closed on
Apr 30, 2002
Sold by
Redding Clifton D
Bought by
Hague Charles R and Hague Ardeen L
Home Financials for this Owner
Home Financials are based on the most recent Mortgage that was taken out on this home.
Original Mortgage
$200,000
Interest Rate
7.16%
Mortgage Type
New Conventional
Purchase Details
Closed on
Aug 25, 2000
Sold by
Nelson Thomas W and Nelson Shelia A
Bought by
Redding Clifton D
Home Financials for this Owner
Home Financials are based on the most recent Mortgage that was taken out on this home.
Original Mortgage
$106,000
Interest Rate
8.07%
Mortgage Type
New Conventional
Create a Home Valuation Report for This Property
The Home Valuation Report is an in-depth analysis detailing your home's value as well as a comparison with similar homes in the area
Home Values in the Area
Average Home Value in this Area
Purchase History
| Date | Buyer | Sale Price | Title Company |
|---|---|---|---|
| Chuck & Ardeen Hague Family Trust | -- | None Listed On Document | |
| Hague Charles R | $250,000 | -- | |
| Redding Clifton D | $30,000 | -- |
Source: Public Records
Mortgage History
| Date | Status | Borrower | Loan Amount |
|---|---|---|---|
| Previous Owner | Hague Charles R | $200,000 | |
| Previous Owner | Redding Clifton D | $106,000 |
Source: Public Records
Tax History Compared to Growth
Tax History
| Year | Tax Paid | Tax Assessment Tax Assessment Total Assessment is a certain percentage of the fair market value that is determined by local assessors to be the total taxable value of land and additions on the property. | Land | Improvement |
|---|---|---|---|---|
| 2025 | $6,802 | $287,060 | $28,000 | $259,060 |
| 2024 | $6,292 | $263,292 | $28,000 | $235,292 |
| 2023 | $3,939 | $179,828 | $22,000 | $157,828 |
| 2022 | $3,705 | $142,816 | $16,000 | $126,816 |
| 2021 | $3,705 | $142,816 | $16,000 | $126,816 |
| 2020 | $3,240 | $121,544 | $16,000 | $105,544 |
| 2019 | $3,293 | $123,984 | $16,000 | $107,984 |
| 2018 | $3,293 | $123,984 | $16,000 | $107,984 |
| 2017 | $2,835 | $109,616 | $16,000 | $93,616 |
| 2016 | $2,775 | $106,788 | $16,000 | $90,788 |
| 2015 | $2,843 | $106,788 | $16,000 | $90,788 |
| 2014 | $2,866 | $106,788 | $0 | $0 |
Source: Public Records
Map
Nearby Homes
- 2946 Oshields Ct SW Unit 3
- 3090 Moser Way
- 3065 Moser Way
- 2896 Oshields Ct SW Unit 1
- 3306 Harrow Ct SW
- 430 Church Rd SW
- 2777 Northwood Ct SW
- 444 White Oak Dr SW
- 2780 Northwood Ct SW
- 187 Timber Creek Ln SW
- 2898 Lakemont Dr SW
- 2896 Lakemont Dr SW
- 117 Radford Cir SW
- 174 Timber Creek Ln SW Unit 176
- 3175 Foxwood Trail SE
- 154 Timber Creek Ln SW Unit 1
- 54 Church Rd SE Unit 1
- 244 Timber Creek Ln SW
- 3041 Brownmoore Dr SW
- 0 Brownmoore Dr Unit 8191921
- 3071 Brownmoore Dr SW
- 3030 Brownmoore Dr SW Unit 2
- 3066 Brownmoore Dr SW
- 3040 Brownmoore Dr SW
- 3080 Brownmoore Dr SW
- 257 Robbie Ln SW
- 257 Robbie Ln SW Unit 9
- 3056 Brownmoore Dr SW
- 3085 Brownmoore Dr SW
- 255 Robbie Ln SW
- 259 Robbie Ln SW
- 266 Renae Ln SW
- 253 Robbie Ln SW
- 3097 Brownmoore Dr SW Unit 2
- 257 Smyrna Powder Springs Rd SW
- 257 Smyrna Powder Springs Rd SW
- 282 Renae Ln SW Unit 2
- 251 Robbie Ln SW