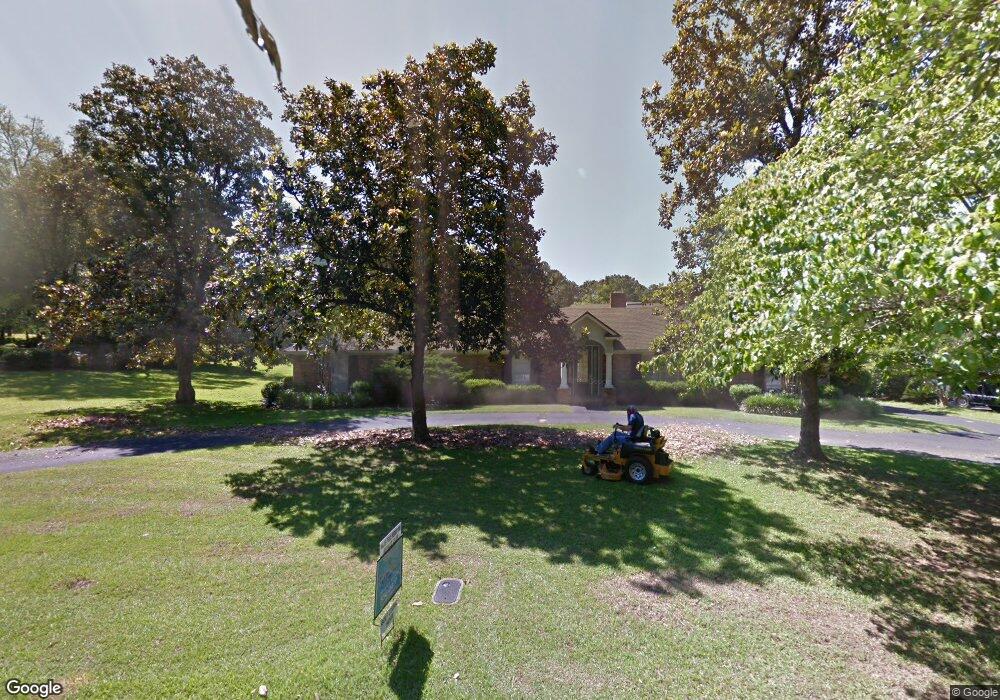
3057 Carlow Cir Unit 6 Tallahassee, FL 32309
Killearn NeighborhoodEstimated Value: $621,000 - $742,234
4
Beds
3
Baths
3,201
Sq Ft
$211/Sq Ft
Est. Value
About This Home
This home is located at 3057 Carlow Cir Unit 6, Tallahassee, FL 32309 and is currently estimated at $675,559, approximately $211 per square foot. 3057 Carlow Cir Unit 6 is a home located in Leon County with nearby schools including Gilchrist Elementary School, William J. Montford III Middle School, and Lincoln High School.
Ownership History
Date
Name
Owned For
Owner Type
Purchase Details
Closed on
Sep 7, 2020
Sold by
Mahone Thomas F and Mahone Laura D
Bought by
Spencer Ronald S and Spencer Jean R
Current Estimated Value
Purchase Details
Closed on
Mar 23, 2016
Sold by
Cavanaugh Patrick and Lemaster Alison
Bought by
Jag Nag Properties Llc
Purchase Details
Closed on
Jul 30, 2004
Sold by
Adams Properties Llc
Bought by
Cavanaugh Patrick and Lemaster Alison
Home Financials for this Owner
Home Financials are based on the most recent Mortgage that was taken out on this home.
Original Mortgage
$353,600
Interest Rate
5.5%
Mortgage Type
Purchase Money Mortgage
Purchase Details
Closed on
Mar 13, 2003
Sold by
Breslin Peter J and Breslin Nancy H
Bought by
Adams Prop L L C
Home Financials for this Owner
Home Financials are based on the most recent Mortgage that was taken out on this home.
Original Mortgage
$276,000
Interest Rate
5.88%
Create a Home Valuation Report for This Property
The Home Valuation Report is an in-depth analysis detailing your home's value as well as a comparison with similar homes in the area
Home Values in the Area
Average Home Value in this Area
Purchase History
| Date | Buyer | Sale Price | Title Company |
|---|---|---|---|
| Spencer Ronald S | -- | None Available | |
| Jag Nag Properties Llc | $335,000 | Attorney | |
| Cavanaugh Patrick | $442,000 | -- | |
| Adams Prop L L C | $150,000 | -- |
Source: Public Records
Mortgage History
| Date | Status | Borrower | Loan Amount |
|---|---|---|---|
| Previous Owner | Cavanaugh Patrick | $353,600 | |
| Previous Owner | Adams Prop L L C | $276,000 |
Source: Public Records
Tax History Compared to Growth
Tax History
| Year | Tax Paid | Tax Assessment Tax Assessment Total Assessment is a certain percentage of the fair market value that is determined by local assessors to be the total taxable value of land and additions on the property. | Land | Improvement |
|---|---|---|---|---|
| 2024 | $13,075 | $679,666 | $80,000 | $599,666 |
| 2023 | $12,344 | $627,793 | $0 | $0 |
| 2022 | $10,950 | $612,847 | $70,000 | $542,847 |
| 2021 | $9,959 | $518,837 | $65,000 | $453,837 |
| 2020 | $9,263 | $494,965 | $65,000 | $429,965 |
| 2019 | $7,032 | $367,892 | $65,000 | $302,892 |
| 2018 | $6,902 | $357,766 | $65,000 | $292,766 |
| 2017 | $6,703 | $343,342 | $0 | $0 |
| 2016 | $6,350 | $320,684 | $0 | $0 |
| 2015 | $5,966 | $298,735 | $0 | $0 |
| 2014 | $5,966 | $299,217 | $0 | $0 |
Source: Public Records
Map
Nearby Homes
- 3903 Dunleer Ct
- 3089 Sawgrass Cir
- 3726 Wicklow Cir
- 2929 Shamrock St S
- 3884 Paddrick Dr
- Lot 2 Edenderry Dr
- 3072 Ironwood Dr
- 3109 Shamrock St S
- 3036 Ironwood Dr
- 2992 Corrib Dr Unit 7
- 4012 Dutchess Ct
- 3207 Shamrock E Unit 19
- 2805 Tipperary Dr
- 2913 Springfield Dr
- 3577 Stowe Trace
- 4022 Delvin Dr
- 3724 Donovan Dr Unit A
- 2935 Bayshore Dr
- 4134 Arklow Dr
- 4076 Roscrea Dr
- 3057 Carlow Cir
- 3053 Carlow Cir
- 3061 Carlow Cir
- 3058 Carlow Cir
- 3052 Carlow Cir
- 3049 Carlow Cir
- 3065 Carlow Cir
- 3841 Longford Dr
- 3048 Carlow Cir
- 3837 Longford Dr
- 3045 Carlow Cir
- 3069 Carlow Cir Unit 6
- 3069 Carlow Cir
- 3040 Waterford Dr
- 3833 Longford Dr Unit 3
- 3833 Longford Dr
- 3044 Waterford Dr Unit 8
- 3044 Waterford Dr
- 3073 Carlow Cir Unit 3
- 3073 Carlow Cir