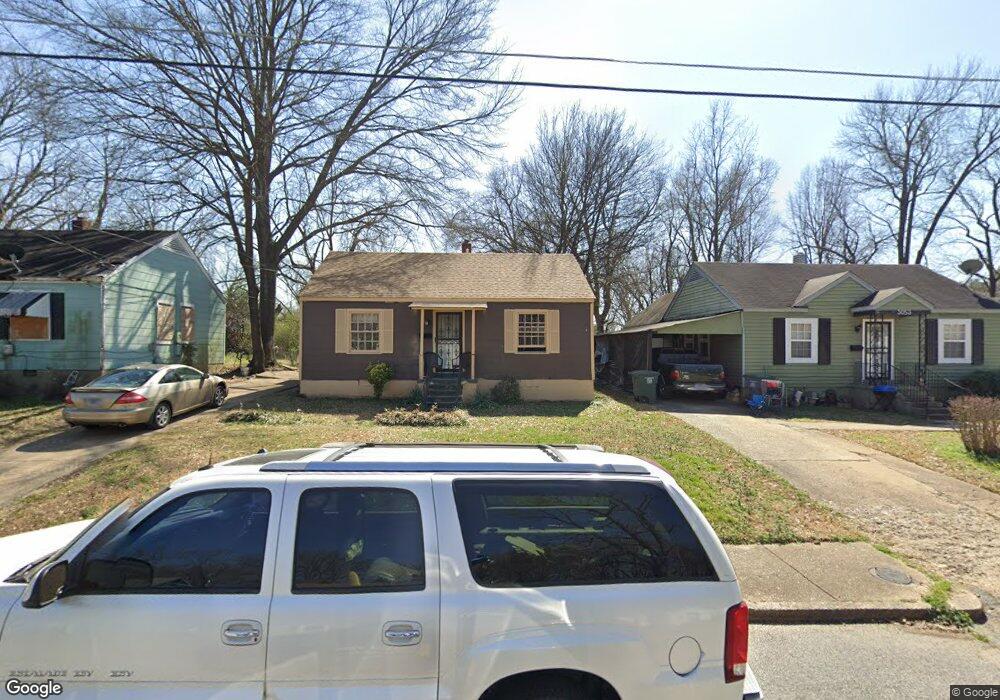
3057 Coleman Ave Memphis, TN 38112
Binghampton NeighborhoodEstimated Value: $47,000 - $55,421
2
Beds
1
Bath
825
Sq Ft
$63/Sq Ft
Est. Value
About This Home
This home is located at 3057 Coleman Ave, Memphis, TN 38112 and is currently estimated at $51,605, approximately $62 per square foot. 3057 Coleman Ave is a home located in Shelby County with nearby schools including Treadwell Elementary School, Treadwell Middle School, and Douglass High School.
Ownership History
Date
Name
Owned For
Owner Type
Purchase Details
Closed on
May 20, 2016
Sold by
Clothier Kent
Bought by
Simpson Arthur R
Current Estimated Value
Purchase Details
Closed on
Aug 15, 2006
Sold by
Melton James B and Melton Mary E
Bought by
Clothier Kent
Home Financials for this Owner
Home Financials are based on the most recent Mortgage that was taken out on this home.
Original Mortgage
$44,800
Interest Rate
6.73%
Mortgage Type
Purchase Money Mortgage
Purchase Details
Closed on
Aug 26, 2002
Sold by
Cashion Evelyn S
Bought by
Melton James B and Melton Mary Ellen
Purchase Details
Closed on
Jan 27, 2000
Sold by
Melton James B
Bought by
Cashion Evelyn and Oliveria Jeremy
Purchase Details
Closed on
May 18, 1998
Sold by
Price Robert L and Price L
Bought by
Melton James Brent
Home Financials for this Owner
Home Financials are based on the most recent Mortgage that was taken out on this home.
Original Mortgage
$10,000
Interest Rate
7.15%
Mortgage Type
Seller Take Back
Create a Home Valuation Report for This Property
The Home Valuation Report is an in-depth analysis detailing your home's value as well as a comparison with similar homes in the area
Home Values in the Area
Average Home Value in this Area
Purchase History
| Date | Buyer | Sale Price | Title Company |
|---|---|---|---|
| Simpson Arthur R | $9,500 | Executive Title & Closing In | |
| Clothier Kent | $15,000 | None Available | |
| Melton James B | -- | -- | |
| Cashion Evelyn | -- | -- | |
| Melton James Brent | $15,000 | Lawyers Title Insurance Corp |
Source: Public Records
Mortgage History
| Date | Status | Borrower | Loan Amount |
|---|---|---|---|
| Previous Owner | Clothier Kent | $44,800 | |
| Previous Owner | Melton James Brent | $10,000 |
Source: Public Records
Tax History Compared to Growth
Tax History
| Year | Tax Paid | Tax Assessment Tax Assessment Total Assessment is a certain percentage of the fair market value that is determined by local assessors to be the total taxable value of land and additions on the property. | Land | Improvement |
|---|---|---|---|---|
| 2025 | $208 | $10,425 | $2,250 | $8,175 |
| 2024 | $208 | $6,125 | $1,125 | $5,000 |
| 2023 | $373 | $6,125 | $1,125 | $5,000 |
| 2022 | $373 | $6,125 | $1,125 | $5,000 |
| 2021 | $377 | $6,125 | $1,125 | $5,000 |
| 2020 | $377 | $5,200 | $1,125 | $4,075 |
| 2019 | $377 | $5,200 | $1,125 | $4,075 |
| 2018 | $377 | $5,200 | $1,125 | $4,075 |
| 2017 | $214 | $5,200 | $1,125 | $4,075 |
| 2016 | $180 | $4,125 | $0 | $0 |
| 2014 | $211 | $4,825 | $0 | $0 |
Source: Public Records
Map
Nearby Homes
- 857 Pope St
- 3174 Given Ave
- 3184 Lamphier Ave
- 971 Hudson St
- 3223 Guernsey Ave
- 3250 Guernsey Ave
- 3117 Pacific Ave
- 3307 Guernsey Ave
- 706 Lester St
- 710 Hudson St
- 3310 Lamphier Ave
- 3347 Given Ave
- 1108 N Holmes St
- 657 N Holmes St
- 3306 Macon Rd
- 765 Los Angeles St
- 745 Los Angeles St
- 3346 Faxon Ave
- 2659 Whitman Ave
- 2601 Jackson Ave
- 3063 Coleman Ave
- 3053 Coleman Ave
- 3067 Coleman Ave
- 3047 Coleman Ave
- 3058 Lyndale Ave
- 3062 Lyndale Ave
- 3043 Coleman Ave
- 3054 Lyndale Ave
- 3068 Lyndale Ave
- 3048 Lyndale Ave
- 3058 Coleman Ave
- 3054 Coleman Ave
- 3064 Coleman Ave
- 3077 Coleman Ave
- 3037 Coleman Ave
- 3074 Lyndale Ave
- 3044 Lyndale Ave
- 3044 Coleman Ave
- 3074 Coleman Ave
- 3078 Lyndale Ave