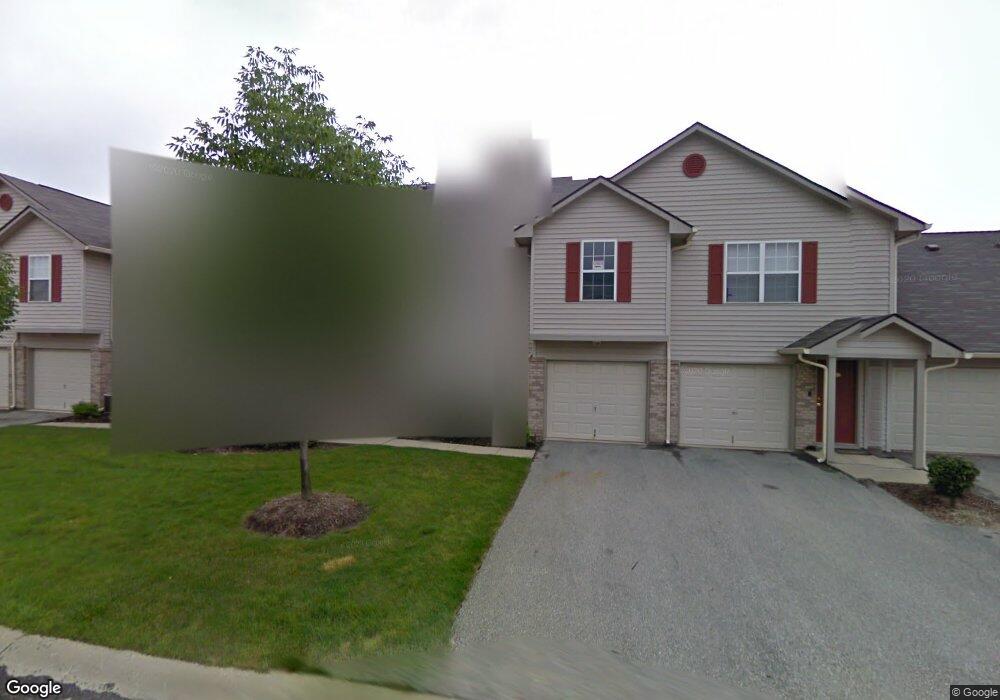
3057 Wildcat Ln Unit U 18 C Indianapolis, IN 46203
Southeast Indianapolis NeighborhoodEstimated Value: $141,000 - $167,000
2
Beds
2
Baths
1,206
Sq Ft
$132/Sq Ft
Est. Value
About This Home
This home is located at 3057 Wildcat Ln Unit U 18 C, Indianapolis, IN 46203 and is currently estimated at $159,631, approximately $132 per square foot. 3057 Wildcat Ln Unit U 18 C is a home located in Marion County with nearby schools including Franklin Central High School, St. John Evangelical Lutheran School, and Nativity Catholic School.
Ownership History
Date
Name
Owned For
Owner Type
Purchase Details
Closed on
May 11, 2022
Sold by
Jessica Parnell
Bought by
Purvis Randi Ann
Current Estimated Value
Home Financials for this Owner
Home Financials are based on the most recent Mortgage that was taken out on this home.
Original Mortgage
$131,400
Outstanding Balance
$124,849
Interest Rate
5.27%
Mortgage Type
New Conventional
Estimated Equity
$34,782
Purchase Details
Closed on
Apr 22, 2022
Sold by
Jessica Parnell
Bought by
Purvis Randi Ann
Home Financials for this Owner
Home Financials are based on the most recent Mortgage that was taken out on this home.
Original Mortgage
$131,400
Outstanding Balance
$124,849
Interest Rate
5.27%
Mortgage Type
New Conventional
Estimated Equity
$34,782
Purchase Details
Closed on
Mar 6, 2019
Sold by
Collins Hoosier
Bought by
Parnell Jessica
Purchase Details
Closed on
Nov 18, 2013
Sold by
Layton John
Bought by
Lee Paull Llc
Create a Home Valuation Report for This Property
The Home Valuation Report is an in-depth analysis detailing your home's value as well as a comparison with similar homes in the area
Home Values in the Area
Average Home Value in this Area
Purchase History
| Date | Buyer | Sale Price | Title Company |
|---|---|---|---|
| Purvis Randi Ann | -- | Security Title | |
| Purvis Randi Ann | $150,000 | Security Title | |
| Parnell Jessica | -- | None Available | |
| Lee Paull Llc | $35,500 | -- |
Source: Public Records
Mortgage History
| Date | Status | Borrower | Loan Amount |
|---|---|---|---|
| Open | Purvis Randi Ann | $131,400 | |
| Closed | Purvis Randi Ann | $131,400 |
Source: Public Records
Tax History Compared to Growth
Tax History
| Year | Tax Paid | Tax Assessment Tax Assessment Total Assessment is a certain percentage of the fair market value that is determined by local assessors to be the total taxable value of land and additions on the property. | Land | Improvement |
|---|---|---|---|---|
| 2024 | $1,222 | $163,300 | $20,900 | $142,400 |
| 2023 | $1,222 | $134,600 | $20,900 | $113,700 |
| 2022 | $1,242 | $116,700 | $20,900 | $95,800 |
| 2021 | $2,103 | $102,700 | $20,900 | $81,800 |
| 2020 | $1,929 | $94,000 | $20,900 | $73,100 |
| 2019 | $1,678 | $81,500 | $20,900 | $60,600 |
| 2018 | $1,578 | $76,500 | $20,900 | $55,600 |
| 2017 | $1,445 | $69,900 | $20,900 | $49,000 |
| 2016 | $1,228 | $65,500 | $20,900 | $44,600 |
| 2014 | $1,474 | $73,700 | $20,900 | $52,800 |
| 2013 | $1,474 | $73,700 | $20,900 | $52,800 |
Source: Public Records
Map
Nearby Homes
- 3017 Wildcat Ln
- 3010 Wildcat Ln
- 3082 Wildcat Ln
- 3061 Wildcat Ln
- 2959 Foxbriar Place
- 3112 Wildcat Ln
- 6070 Wildcat Dr
- 6027 Moonseed Cir
- 6435 Birds Eye Dr
- 3341 Carica Dr
- 3362 Pavetto Ln
- 3065 Hemlock Way
- 5811 E Troy Ave
- 3481 Capsella Ln
- 2735 S Pasadena St
- 2638 S Arlington Ave
- 2823 S Irwin St
- 6709 Southeastern Ave
- 8435 Southeastern Ave
- 2708 S Hunter Rd
- 3057 Wildcat Ln
- 3057 Wildcat Ln Unit 18-C
- 3055 Wildcat Ln
- 3055 Wildcat Ln Unit 18-D
- 3055 Wildcat Ln Unit 18/18D
- 3069 Wildcat Ln
- 3069 Wildcat Ln Unit 181
- 3069 Wildcat Ln Unit 18
- 3059 Wildcat Ln
- 3059 Wildcat Ln Unit 18B
- 3067 Wildcat Ln
- 3053 Wildcat Ln
- 3071 Wildcat Ln
- 3071 Wildcat Ln Unit 18
- 3051 Wildcat Ln
- 3051 Wildcat Ln Unit 18F
- 3065 Wildcat Ln
- 3078 Wildcat Ln
- 3092 Wildcat Ln Unit 13G
- 3064 Wildcat Ln