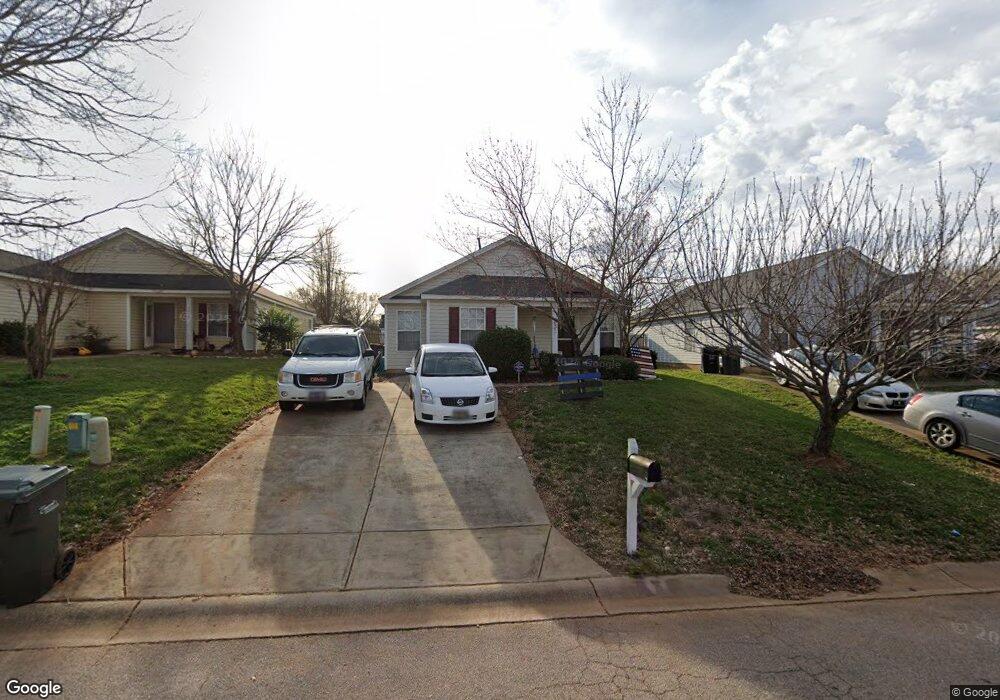
3057 Winners Cir SW Concord, NC 28025
Estimated Value: $203,000 - $245,000
2
Beds
2
Baths
960
Sq Ft
$236/Sq Ft
Est. Value
About This Home
This home is located at 3057 Winners Cir SW, Concord, NC 28025 and is currently estimated at $226,505, approximately $235 per square foot. 3057 Winners Cir SW is a home located in Cabarrus County with nearby schools including Rocky River Elementary School, J.N. Fries Middle School, and The Daniel Academy of Concord.
Ownership History
Date
Name
Owned For
Owner Type
Purchase Details
Closed on
May 13, 2005
Sold by
Laney Harold
Bought by
Dudash Susan L
Current Estimated Value
Home Financials for this Owner
Home Financials are based on the most recent Mortgage that was taken out on this home.
Original Mortgage
$81,035
Outstanding Balance
$42,632
Interest Rate
5.98%
Mortgage Type
Fannie Mae Freddie Mac
Estimated Equity
$183,873
Purchase Details
Closed on
Sep 27, 2002
Sold by
Mcgurn Susan F
Bought by
Laney Harold
Home Financials for this Owner
Home Financials are based on the most recent Mortgage that was taken out on this home.
Original Mortgage
$84,250
Interest Rate
6.19%
Purchase Details
Closed on
Jul 23, 1998
Sold by
Beazer Homes Corp
Bought by
Mcgurn Susan F
Home Financials for this Owner
Home Financials are based on the most recent Mortgage that was taken out on this home.
Original Mortgage
$78,988
Interest Rate
7.02%
Mortgage Type
FHA
Create a Home Valuation Report for This Property
The Home Valuation Report is an in-depth analysis detailing your home's value as well as a comparison with similar homes in the area
Home Values in the Area
Average Home Value in this Area
Purchase History
| Date | Buyer | Sale Price | Title Company |
|---|---|---|---|
| Dudash Susan L | $85,500 | -- | |
| Laney Harold | $84,500 | -- | |
| Mcgurn Susan F | $81,500 | -- |
Source: Public Records
Mortgage History
| Date | Status | Borrower | Loan Amount |
|---|---|---|---|
| Open | Dudash Susan L | $81,035 | |
| Previous Owner | Laney Harold | $84,250 | |
| Previous Owner | Mcgurn Susan F | $78,988 |
Source: Public Records
Tax History Compared to Growth
Tax History
| Year | Tax Paid | Tax Assessment Tax Assessment Total Assessment is a certain percentage of the fair market value that is determined by local assessors to be the total taxable value of land and additions on the property. | Land | Improvement |
|---|---|---|---|---|
| 2025 | $2,137 | $214,570 | $65,000 | $149,570 |
| 2024 | $2,137 | $214,570 | $65,000 | $149,570 |
| 2023 | $1,463 | $119,930 | $34,000 | $85,930 |
| 2022 | $1,463 | $119,930 | $34,000 | $85,930 |
| 2021 | $1,463 | $119,930 | $34,000 | $85,930 |
| 2020 | $1,463 | $119,930 | $34,000 | $85,930 |
| 2019 | $1,047 | $85,790 | $18,000 | $67,790 |
| 2018 | $1,029 | $85,790 | $18,000 | $67,790 |
| 2017 | $1,012 | $85,790 | $18,000 | $67,790 |
| 2016 | $601 | $76,510 | $18,000 | $58,510 |
| 2015 | $903 | $76,510 | $18,000 | $58,510 |
| 2014 | $903 | $76,510 | $18,000 | $58,510 |
Source: Public Records
Map
Nearby Homes
- 3073 Champion Ln SW
- 3168 Sossamon Place
- 493 Debra Cir SW
- 518 Viking Place SW
- 2824 Trestle Ct SW
- 2893 Signal Ct SW
- 609 Faith Dr SW Unit 1
- 4285 Long Arrow Dr
- Lot #2 Faith Dr SW
- 1255 Old Charlotte Rd
- 809 Fargo Dr SW
- 758 Main St SW
- 84 Highland Ave SW
- 782 Chalice St SW
- 82 Highland Ave SW
- 668 Shellbark Dr
- 1067 Old Charlotte Rd
- 760 Bartram Ave Unit 114
- 269 Fryling Ave SW
- 664 Jackson Terrace SW
- 3061 Winners Cir SW
- 3053 Winners Cir SW
- 3049 Winners Cir SW
- 3065 Winners Cir SW
- 3052 Parade Ln SW
- 3052 Parade Ln SW Unit 101
- 3056 Parade Ln SW
- 3048 Parade Ln SW
- 3060 Parade Ln SW
- 3044 Parade Ln SW
- 3069 Winners Cir SW
- 3045 Winners Cir SW
- 3056 Winners Cir SW
- 3052 Winners Cir SW
- 3060 Winners Cir SW
- 3064 Parade Ln SW
- 3048 Winners Cir SW
- 3040 Parade Ln SW
- 3073 Winners Cir SW
- 3041 Winners Cir SW