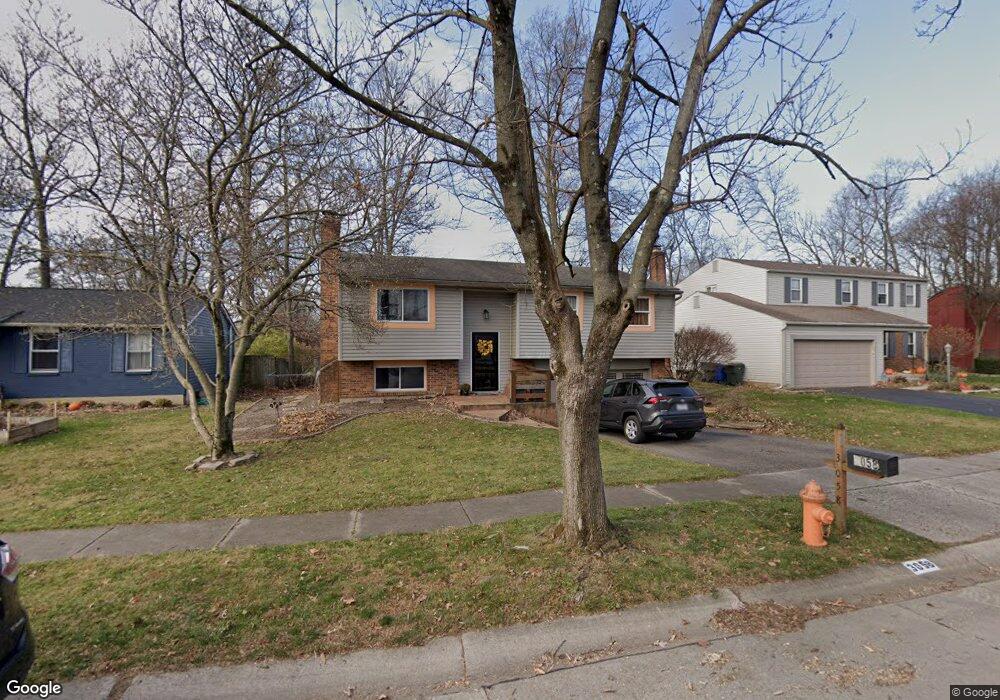
3058 Woodloop Ln Columbus, OH 43204
Marble Cliff Crossing NeighborhoodEstimated Value: $284,000 - $368,000
3
Beds
2
Baths
1,488
Sq Ft
$212/Sq Ft
Est. Value
About This Home
This home is located at 3058 Woodloop Ln, Columbus, OH 43204 and is currently estimated at $315,645, approximately $212 per square foot. 3058 Woodloop Ln is a home located in Franklin County with nearby schools including Valleyview Elementary School, Westmoor Middle School, and West High School.
Ownership History
Date
Name
Owned For
Owner Type
Purchase Details
Closed on
Jan 19, 2010
Sold by
Palecek Eric J
Bought by
Flanigan Thomas W
Current Estimated Value
Home Financials for this Owner
Home Financials are based on the most recent Mortgage that was taken out on this home.
Original Mortgage
$112,942
Outstanding Balance
$75,018
Interest Rate
5.5%
Mortgage Type
FHA
Estimated Equity
$240,627
Purchase Details
Closed on
Aug 27, 2004
Sold by
Hart Raymond E and Hart Kathy L
Bought by
Palecek Eric J
Home Financials for this Owner
Home Financials are based on the most recent Mortgage that was taken out on this home.
Original Mortgage
$127,350
Interest Rate
6.17%
Mortgage Type
FHA
Purchase Details
Closed on
Sep 22, 1995
Sold by
Shaffer Brian L
Bought by
Hart Raymond E and Hart Kathy L
Home Financials for this Owner
Home Financials are based on the most recent Mortgage that was taken out on this home.
Original Mortgage
$85,685
Interest Rate
7.78%
Mortgage Type
FHA
Purchase Details
Closed on
Feb 1, 1984
Purchase Details
Closed on
Mar 1, 1980
Create a Home Valuation Report for This Property
The Home Valuation Report is an in-depth analysis detailing your home's value as well as a comparison with similar homes in the area
Home Values in the Area
Average Home Value in this Area
Purchase History
| Date | Buyer | Sale Price | Title Company |
|---|---|---|---|
| Flanigan Thomas W | $117,000 | Talon Group | |
| Palecek Eric J | $129,400 | Chicago Tit | |
| Hart Raymond E | $86,300 | -- | |
| -- | $61,000 | -- | |
| -- | $50,500 | -- |
Source: Public Records
Mortgage History
| Date | Status | Borrower | Loan Amount |
|---|---|---|---|
| Open | Flanigan Thomas W | $112,942 | |
| Previous Owner | Palecek Eric J | $127,350 | |
| Previous Owner | Hart Raymond E | $85,685 |
Source: Public Records
Tax History
| Year | Tax Paid | Tax Assessment Tax Assessment Total Assessment is a certain percentage of the fair market value that is determined by local assessors to be the total taxable value of land and additions on the property. | Land | Improvement |
|---|---|---|---|---|
| 2025 | $3,701 | $82,470 | $23,420 | $59,050 |
| 2024 | $3,701 | $82,470 | $23,420 | $59,050 |
| 2023 | $3,654 | $82,460 | $23,415 | $59,045 |
| 2022 | $2,975 | $57,370 | $17,220 | $40,150 |
| 2021 | $2,981 | $57,370 | $17,220 | $40,150 |
| 2020 | $2,985 | $57,370 | $17,220 | $40,150 |
| 2019 | $2,709 | $44,660 | $13,230 | $31,430 |
| 2018 | $2,577 | $44,660 | $13,230 | $31,430 |
| 2017 | $2,708 | $44,660 | $13,230 | $31,430 |
| 2016 | $2,699 | $40,750 | $9,140 | $31,610 |
| 2015 | $2,450 | $40,750 | $9,140 | $31,610 |
| 2014 | $2,456 | $40,750 | $9,140 | $31,610 |
| 2013 | $1,212 | $40,740 | $9,135 | $31,605 |
Source: Public Records
Map
Nearby Homes
- 1350 Baja Ln Unit 10
- 3079 Jersey Dr Unit 75
- 3271 Dover Rd
- 2022 Lake Shore Dr
- 2288 Quarry Trails Dr
- 2250 Quarry Trails Dr
- 2252 Quarry Trails Dr
- 2256 Quarry Trails Dr
- 2262 Quarry Trails Dr
- 2842 Gunnison Dr Unit 402
- 2842 Gunnison Dr Unit 303
- 2842 Gunnison Dr Unit 203
- 2842 Gunnison Dr Unit 401
- 2842 Gunnison Dr Unit 201
- 2842 Gunnison Dr Unit 304
- 2842 Gunnison Dr Unit 202
- 2842 Gunnison Dr Unit 404
- 2842 Gunnison Dr Unit 204
- 2842 Gunnison Dr Unit 302
- 2842 Gunnison Dr Unit 303
- 3062 Woodloop Ln
- 3054 Woodloop Ln
- 3054 Cortona Rd
- 3037 Woodloop Ln
- 3050 Woodloop Ln
- 3049 Woodloop Ln
- 3046 Woodloop Ln
- 3027 Woodloop Ln
- 3024 Cortona Rd
- 3040 Woodloop Ln
- 1673 N Hague Ave
- 1677 N Hague Ave
- 1665 N Hague Ave
- 3034 Woodloop Ln
- 3019 Woodloop Ln
- 3041 Cortona Rd
- 3051 Cortona Rd
- 1685 N Hague Ave
- 3016 Cortona Rd
- 1696 N Hague Ave
Your Personal Tour Guide
Ask me questions while you tour the home.