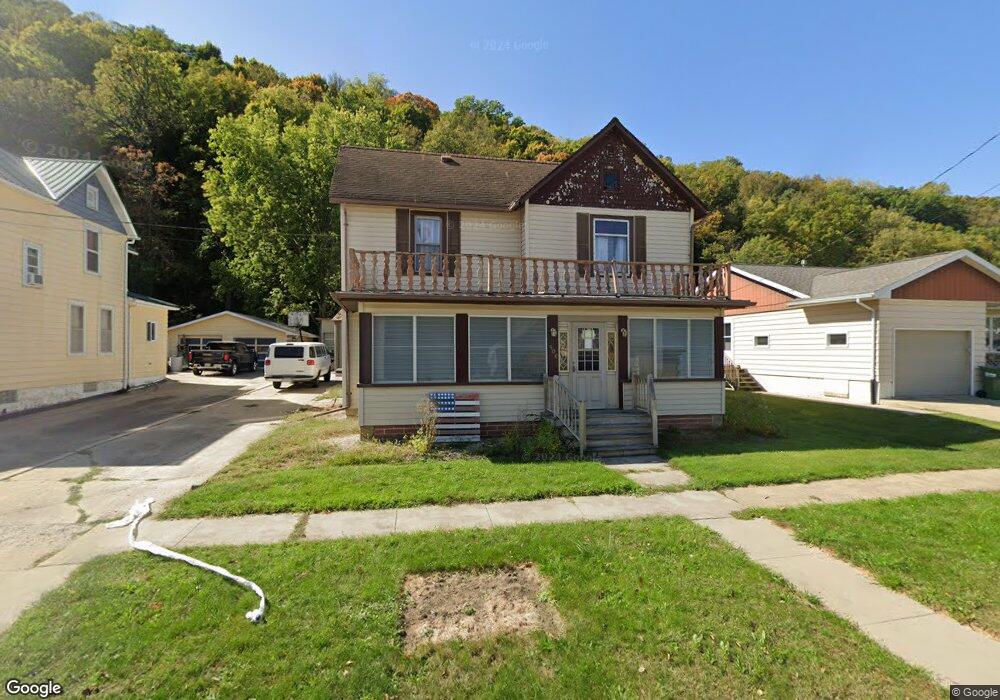
306 2nd St NW Elkader, IA 52043
Estimated Value: $200,793 - $243,000
5
Beds
3
Baths
2,232
Sq Ft
$96/Sq Ft
Est. Value
About This Home
This home is located at 306 2nd St NW, Elkader, IA 52043 and is currently estimated at $213,948, approximately $95 per square foot. 306 2nd St NW is a home located in Clayton County with nearby schools including Central Elementary School and Central Middle School/High School.
Create a Home Valuation Report for This Property
The Home Valuation Report is an in-depth analysis detailing your home's value as well as a comparison with similar homes in the area
Tax History
| Year | Tax Paid | Tax Assessment Tax Assessment Total Assessment is a certain percentage of the fair market value that is determined by local assessors to be the total taxable value of land and additions on the property. | Land | Improvement |
|---|---|---|---|---|
| 2025 | $3,438 | $192,407 | $10,474 | $181,933 |
| 2024 | $3,272 | $161,460 | $9,108 | $152,352 |
| 2023 | $3,198 | $161,460 | $9,108 | $152,352 |
| 2022 | $2,960 | $131,361 | $8,250 | $123,111 |
| 2021 | $2,676 | $131,361 | $8,250 | $123,111 |
| 2020 | $2,676 | $124,345 | $8,250 | $116,095 |
| 2019 | $2,410 | $124,345 | $8,250 | $116,095 |
| 2018 | $2,410 | $115,085 | $8,250 | $106,835 |
| 2017 | $2,368 | $115,085 | $8,250 | $106,835 |
| 2015 | $1,512 | $74,675 | $10,164 | $64,511 |
| 2014 | $1,420 | $74,675 | $10,164 | $64,511 |
Source: Public Records
Map
Nearby Homes
- 301 N 1st St
- 117 S Main St
- 702 N Main St
- 707 N Main St
- 200 High St SE
- 302 N 3rd St
- 0 E Bridge St
- 710 Woodland Dr NW
- 106 Reimer St SW
- 247 Franzen Ridge Rd
- 249 Franzen Ridge Rd
- 27766 Highway 13
- 14149 Iowa 56
- 27455 Harbor Rd
- 0 Grandview Rd
- 108 Adams Ct
- 306 S Monroe St
- Impala Rd
- 0 Trail Unit 731028
- 36648 Crystal Rd
Your Personal Tour Guide
Ask me questions while you tour the home.