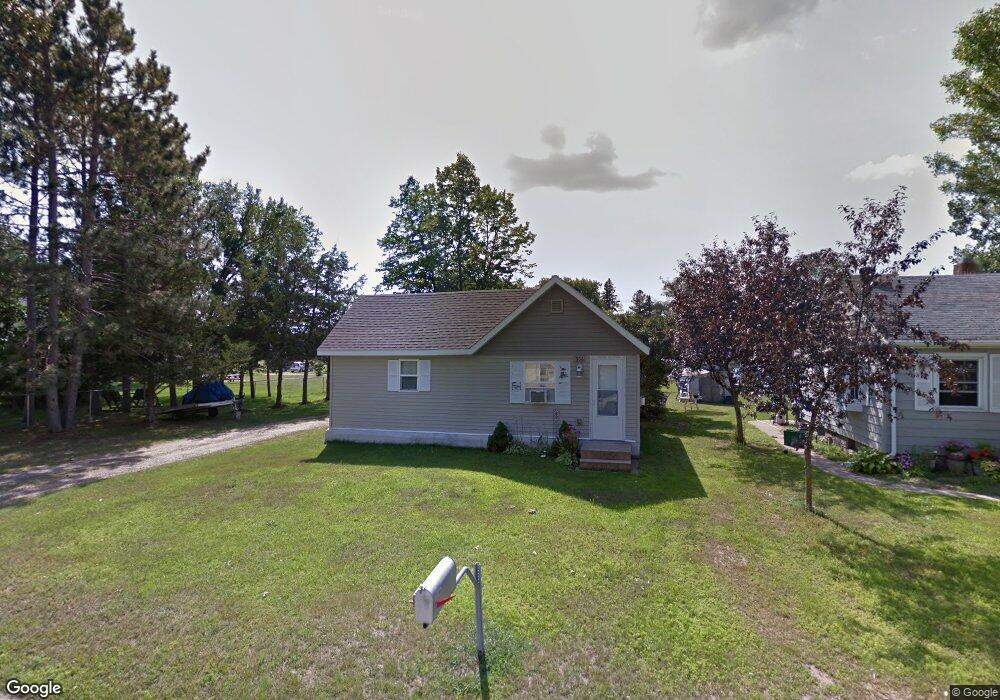
306 5th St SW Little Falls, MN 56345
Estimated Value: $97,000 - $132,000
1
Bed
1
Bath
546
Sq Ft
$206/Sq Ft
Est. Value
About This Home
This home is located at 306 5th St SW, Little Falls, MN 56345 and is currently estimated at $112,369, approximately $205 per square foot. 306 5th St SW is a home located in Morrison County with nearby schools including Little Falls Senior High School, Mary of Lourdes School, and Mary of Lourdes Elementary.
Ownership History
Date
Name
Owned For
Owner Type
Purchase Details
Closed on
Oct 30, 2020
Sold by
Dj Holding Llc
Bought by
Prax Steve
Current Estimated Value
Purchase Details
Closed on
May 13, 2010
Sold by
Popp Dale E and Popp Colleen A
Bought by
Dj Holding Llc
Home Financials for this Owner
Home Financials are based on the most recent Mortgage that was taken out on this home.
Original Mortgage
$44,868
Interest Rate
5.16%
Mortgage Type
Purchase Money Mortgage
Create a Home Valuation Report for This Property
The Home Valuation Report is an in-depth analysis detailing your home's value as well as a comparison with similar homes in the area
Home Values in the Area
Average Home Value in this Area
Purchase History
| Date | Buyer | Sale Price | Title Company |
|---|---|---|---|
| Prax Steve | $59,870 | None Available | |
| Dj Holding Llc | $58,000 | None Available |
Source: Public Records
Mortgage History
| Date | Status | Borrower | Loan Amount |
|---|---|---|---|
| Previous Owner | Dj Holding Llc | $44,868 |
Source: Public Records
Tax History Compared to Growth
Tax History
| Year | Tax Paid | Tax Assessment Tax Assessment Total Assessment is a certain percentage of the fair market value that is determined by local assessors to be the total taxable value of land and additions on the property. | Land | Improvement |
|---|---|---|---|---|
| 2025 | $854 | $98,000 | $16,000 | $82,000 |
| 2024 | $898 | $94,900 | $16,000 | $78,900 |
| 2023 | $702 | $91,400 | $14,000 | $77,400 |
| 2022 | $606 | $75,100 | $14,000 | $61,100 |
| 2021 | $598 | $62,200 | $13,200 | $49,000 |
| 2020 | $572 | $167,300 | $39,600 | $127,700 |
| 2019 | $576 | $55,300 | $13,200 | $42,100 |
| 2018 | $556 | $51,700 | $13,200 | $38,500 |
| 2017 | $530 | $49,500 | $13,200 | $36,300 |
| 2016 | $504 | $0 | $0 | $0 |
| 2014 | $510 | $0 | $0 | $0 |
| 2013 | $510 | $0 | $0 | $0 |
Source: Public Records
Map
Nearby Homes