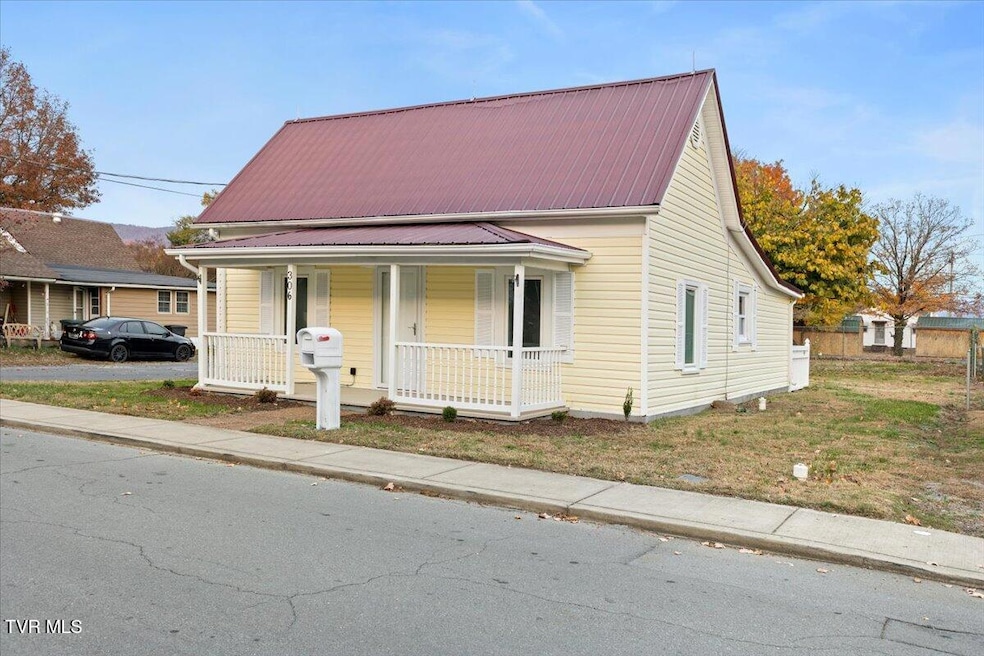
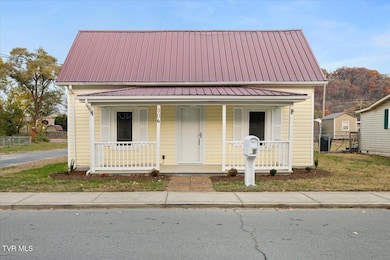
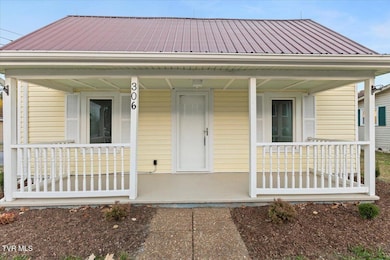
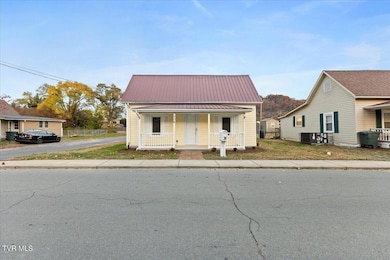
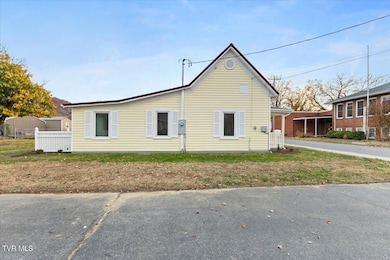
306 Academy St Elizabethton, TN 37643
Downtown Elizabethton NeighborhoodEstimated payment $785/month
Highlights
- Ranch Style House
- Window Unit Cooling System
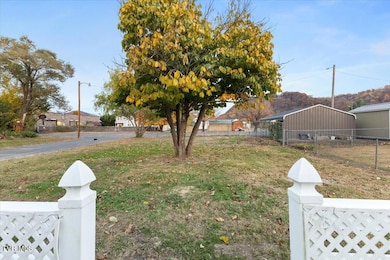
- Level Lot
- No HOA
- Baseboard Heating
About This Home
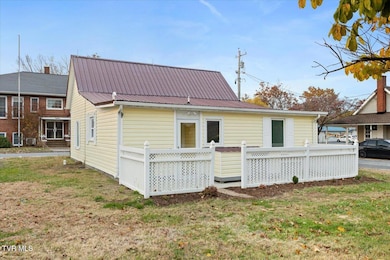
Are you looking for location with an affordable price ? Here you have it, this updated home is within walking distance to the great downtown. How offers 2 bedrooms and refinished hardwood floors. The house has all been freshly painted. You want to come check this out before its to late. Square footage and dimensions are approximate. Buyer should do his or her own research of assignments. Buyer or buyer's agent to verify all information. Information is not guaranteed
Home Details
Home Type
- Single Family
Est. Annual Taxes
- $570
Year Built
- Built in 1900
Lot Details
- 6,098 Sq Ft Lot
- Level Lot
- Property is in average condition
Home Design
- 986 Sq Ft Home
- Ranch Style House
- Metal Roof
- Vinyl Siding
Bedrooms and Bathrooms
- 2 Bedrooms
- 1 Full Bathroom
Schools
- Harold Mccormick Elementary School
- T A Dugger Middle School
- Elizabethton High School
Utilities
- Window Unit Cooling System
- Baseboard Heating
Community Details
- No Home Owners Association
Listing and Financial Details
- Assessor Parcel Number 041c E 053.00
Map
Home Values in the Area
Average Home Value in this Area
Tax History
| Year | Tax Paid | Tax Assessment Tax Assessment Total Assessment is a certain percentage of the fair market value that is determined by local assessors to be the total taxable value of land and additions on the property. | Land | Improvement |
|---|---|---|---|---|
| 2024 | $570 | $17,300 | $2,575 | $14,725 |
| 2023 | $570 | $17,300 | $0 | $0 |
| 2022 | $617 | $17,150 | $2,575 | $14,575 |
| 2021 | $348 | $17,150 | $2,575 | $14,575 |
| 2020 | $640 | $17,150 | $2,575 | $14,575 |
| 2019 | $640 | $14,825 | $2,575 | $12,250 |
| 2018 | $631 | $14,825 | $2,575 | $12,250 |
| 2017 | $635 | $14,825 | $2,575 | $12,250 |
| 2016 | $632 | $14,900 | $2,575 | $12,325 |
| 2015 | $633 | $14,900 | $2,575 | $12,325 |
| 2014 | $642 | $15,025 | $2,575 | $12,450 |
Property History
| Date | Event | Price | List to Sale | Price per Sq Ft |
|---|---|---|---|---|
| 11/14/2025 11/14/25 | Pending | -- | -- | -- |
| 11/11/2025 11/11/25 | For Sale | $139,900 | -- | $142 / Sq Ft |
Purchase History
| Date | Type | Sale Price | Title Company |
|---|---|---|---|
| Trustee Deed | $13,101 | None Listed On Document | |
| Trustee Deed | $13,101 | None Listed On Document | |
| Warranty Deed | $75,000 | -- | |
| Deed | $60,000 | -- | |
| Deed | $35,000 | -- | |
| Deed | -- | -- | |
| Deed | -- | -- | |
| Deed | -- | -- |
Mortgage History
| Date | Status | Loan Amount | Loan Type |
|---|---|---|---|
| Previous Owner | $75,000 | Commercial |
Source: Tennessee/Virginia Regional MLS
MLS Number: 9988194
APN: 041C-E-053.00
Disclaimer: Certain information contained herein is derived from information provided by parties other than Homes.com. All information provided is deemed reliable, but is not guaranteed to be accurate and should be independently verified.
![]() IDX information is provided exclusively for personal, non-commercial use, and may not be used for any purpose other than to identify prospective properties consumers may be interested in purchasing. Some or all of the listings displayed may not belong to the firm whose website is being visited
IDX information is provided exclusively for personal, non-commercial use, and may not be used for any purpose other than to identify prospective properties consumers may be interested in purchasing. Some or all of the listings displayed may not belong to the firm whose website is being visited
Listing information is deemed reliable, but not guaranteed.
