M
Landlord's Agent in 2020
Meybohm Property Management Team
Meybohm
(706) 733-6497
1 Total Sale
Estimated Value: $124,000 - $179,000
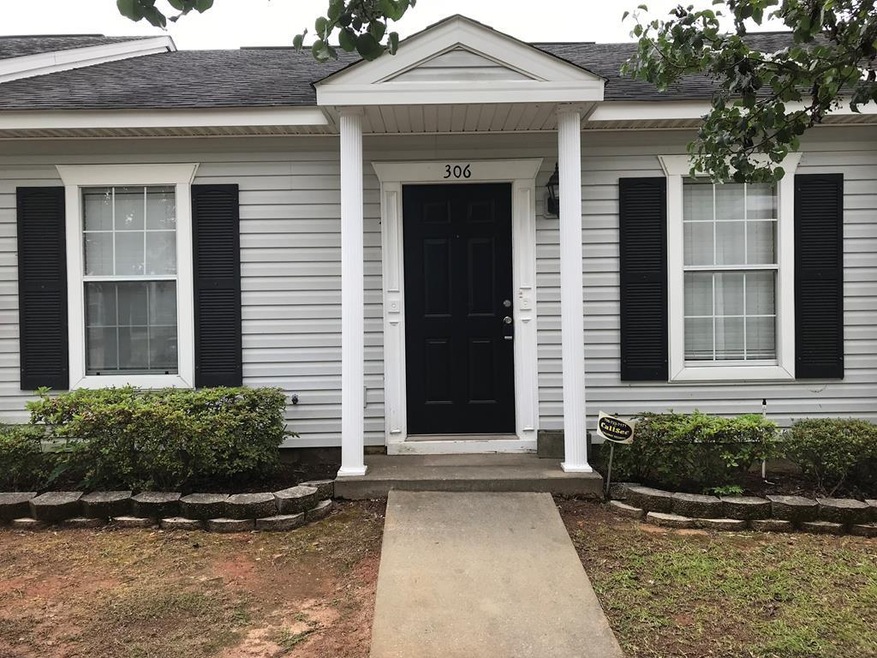
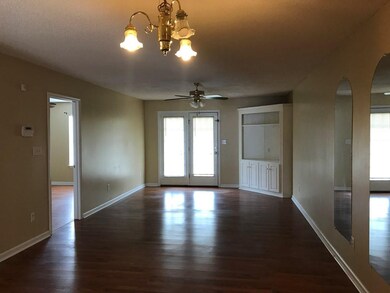
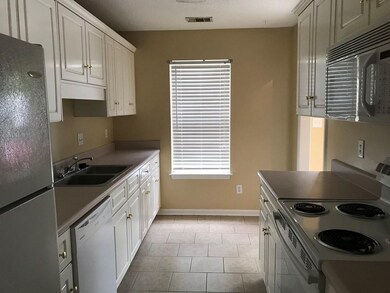
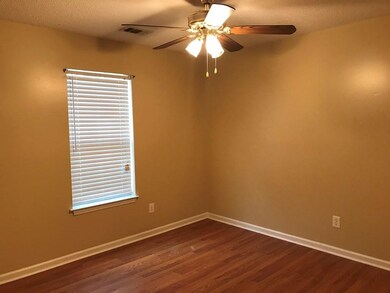
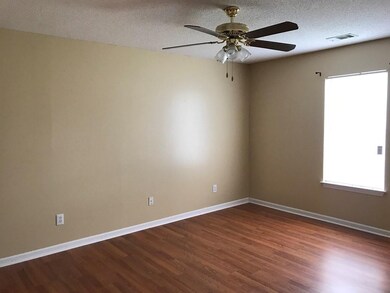
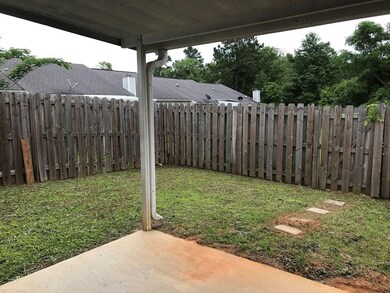
Available Now! Attached condo with approximately 1100 square feet. Living room/Dining room combination. Kitchen with all appliances: stove, dishwasher, microwave and refrigerator. Washer/dryer connections. Patio with fenced yard. Service animals only. Total Electric. School zones must be verified as they are subject to change
Last Agent to Rent the Property
Meybohm Property Management Team
Meybohm Real Estate - Wheeler Listed on: 01/27/2020

| Date | Buyer | Sale Price | Title Company |
|---|---|---|---|
| Johnson Derrick Bernard | $52,000 | -- | |
| Hixon Gerlad W | -- | -- | |
| Hixon Gerlad W | $57,000 | -- |
| Date | Status | Borrower | Loan Amount |
|---|---|---|---|
| Open | Johnson Derrick Bernard | $53,040 |
| Date | Event | Price | List to Sale | Price per Sq Ft |
|---|---|---|---|---|
| 03/28/2020 03/28/20 | Off Market | $875 | -- | -- |
| 03/27/2020 03/27/20 | Rented | $875 | 0.0% | -- |
| 01/27/2020 01/27/20 | For Rent | $875 | +2.9% | -- |
| 07/26/2018 07/26/18 | Rented | $850 | -- | -- |
| Year | Tax Paid | Tax Assessment Tax Assessment Total Assessment is a certain percentage of the fair market value that is determined by local assessors to be the total taxable value of land and additions on the property. | Land | Improvement |
|---|---|---|---|---|
| 2025 | $1,772 | $53,448 | $5,600 | $47,848 |
| 2024 | $1,772 | $48,460 | $5,600 | $42,860 |
| 2023 | $855 | $40,896 | $5,600 | $35,296 |
| 2022 | $1,179 | $32,974 | $5,600 | $27,374 |
| 2021 | $1,055 | $26,450 | $5,600 | $20,850 |
| 2020 | $1,042 | $26,450 | $5,600 | $20,850 |
| 2019 | $1,090 | $26,450 | $5,600 | $20,850 |
| 2018 | $1,095 | $26,450 | $5,600 | $20,850 |
| 2017 | $1,022 | $26,450 | $5,600 | $20,850 |
| 2016 | $1,023 | $26,450 | $5,600 | $20,850 |
| 2015 | $1,028 | $26,450 | $5,600 | $20,850 |
| 2014 | $1,022 | $26,217 | $5,600 | $20,617 |
M
Landlord's Agent in 2020
Meybohm Property Management Team
Meybohm
(706) 733-6497
1 Total Sale
S
Seller's Agent in 2018
Simona Smallwood
Meybohm
Source: REALTORS® of Greater Augusta
MLS Number: 451035
APN: 1401013000
Disclaimer: Certain information contained herein is derived from information provided by parties other than Homes.com. All information provided is deemed reliable, but is not guaranteed to be accurate and should be independently verified.
![]() IDX information is provided exclusively for personal, non-commercial use, and may not be used for any purpose other than to identify prospective properties consumers may be interested in purchasing.
IDX information is provided exclusively for personal, non-commercial use, and may not be used for any purpose other than to identify prospective properties consumers may be interested in purchasing.
Information is deemed reliable but not guaranteed.