Estimated Value: $297,401 - $403,000
--
Bed
--
Bath
2,662
Sq Ft
$128/Sq Ft
Est. Value
About This Home
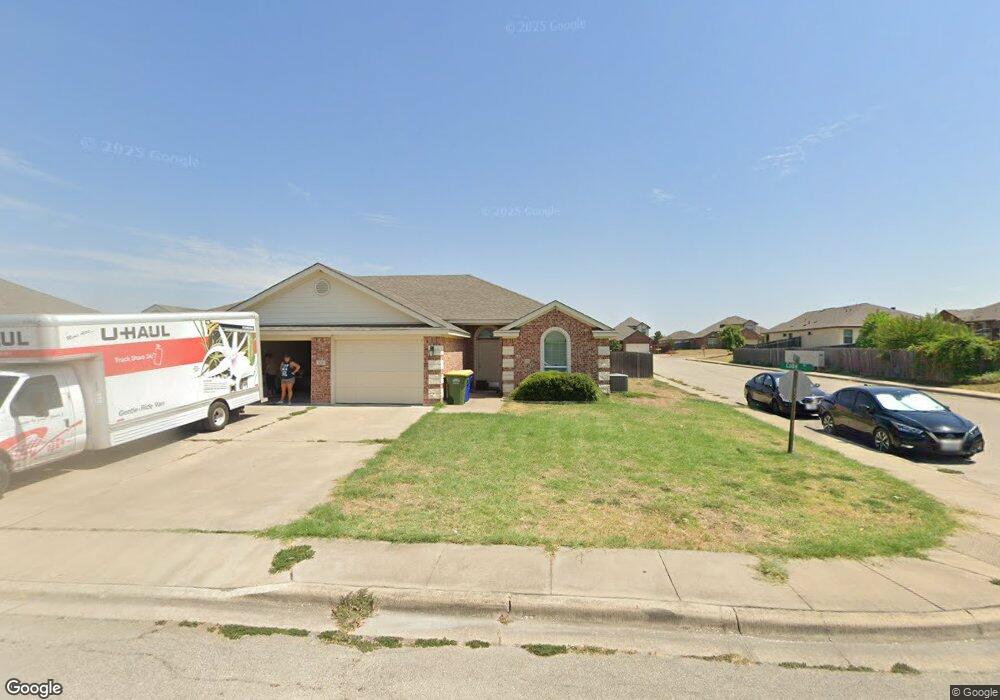
This home is located at 306 Coby Dr, Troy, TX 76579 and is currently estimated at $339,850, approximately $127 per square foot. 306 Coby Dr is a home located in Bell County with nearby schools including Edna Bigham Mays Elementary School, Troy Elementary School, and Raymond Mays Middle School.
Ownership History
Date
Name
Owned For
Owner Type
Purchase Details
Closed on
Sep 14, 2012
Sold by
Holcomb Jim and Jim Holcomb Construction
Bought by
Holcomb James and Holcomb Peggy
Current Estimated Value
Purchase Details
Closed on
Dec 16, 2011
Sold by
Wade Curt
Bought by
Holcomb Jim
Home Financials for this Owner
Home Financials are based on the most recent Mortgage that was taken out on this home.
Original Mortgage
$20,000
Interest Rate
4.03%
Mortgage Type
Purchase Money Mortgage
Purchase Details
Closed on
May 20, 2010
Sold by
5 & 1 Investors Ltd
Bought by
Wade Curt
Home Financials for this Owner
Home Financials are based on the most recent Mortgage that was taken out on this home.
Original Mortgage
$18,000
Interest Rate
5%
Mortgage Type
Purchase Money Mortgage
Create a Home Valuation Report for This Property
The Home Valuation Report is an in-depth analysis detailing your home's value as well as a comparison with similar homes in the area
Home Values in the Area
Average Home Value in this Area
Purchase History
| Date | Buyer | Sale Price | Title Company |
|---|---|---|---|
| Holcomb James | -- | None Available | |
| Holcomb Jim | -- | Centraland Title Co | |
| Wade Curt | -- | Centraland Title Co |
Source: Public Records
Mortgage History
| Date | Status | Borrower | Loan Amount |
|---|---|---|---|
| Previous Owner | Holcomb Jim | $20,000 | |
| Previous Owner | Wade Curt | $18,000 |
Source: Public Records
Tax History Compared to Growth
Tax History
| Year | Tax Paid | Tax Assessment Tax Assessment Total Assessment is a certain percentage of the fair market value that is determined by local assessors to be the total taxable value of land and additions on the property. | Land | Improvement |
|---|---|---|---|---|
| 2025 | $5,907 | $336,402 | $38,000 | $298,402 |
| 2024 | $5,907 | $342,492 | $38,000 | $304,492 |
| 2023 | $5,650 | $336,736 | $32,000 | $304,736 |
| 2022 | $5,886 | $302,314 | $26,000 | $276,314 |
| 2021 | $5,910 | $262,663 | $24,140 | $238,523 |
| 2020 | $5,270 | $216,057 | $24,140 | $191,917 |
| 2019 | $4,687 | $196,913 | $24,140 | $172,773 |
| 2018 | $4,474 | $187,976 | $24,140 | $163,836 |
| 2017 | $4,333 | $180,529 | $24,140 | $156,389 |
| 2016 | $4,405 | $183,508 | $24,140 | $159,368 |
| 2015 | $2,687 | $183,508 | $24,140 | $159,368 |
| 2014 | $2,687 | $112,048 | $0 | $0 |
Source: Public Records
Map
Nearby Homes
- 401 Kayla St
- 406 Coby Dr
- The 1651 Plan at The Village at Elm Creek
- The 1613 Plan at The Village at Elm Creek
- The 1514 Plan at The Village at Elm Creek
- The 1818 Plan at The Village at Elm Creek
- The 1262 Plan at The Village at Elm Creek
- The 1363 Plan at The Village at Elm Creek
- The 2082 Plan at The Village at Elm Creek
- The 1443 Plan at The Village at Elm Creek
- 1005 Leah Dr
- 310 Kayla St
- 301 State Loop
- 117 University Ave
- 1214 S College Ave
- 1202 S College Ave
- 1122 S College Ave
- 1118 S College Ave
- 1213 S College Ave
- 1209 S College Ave