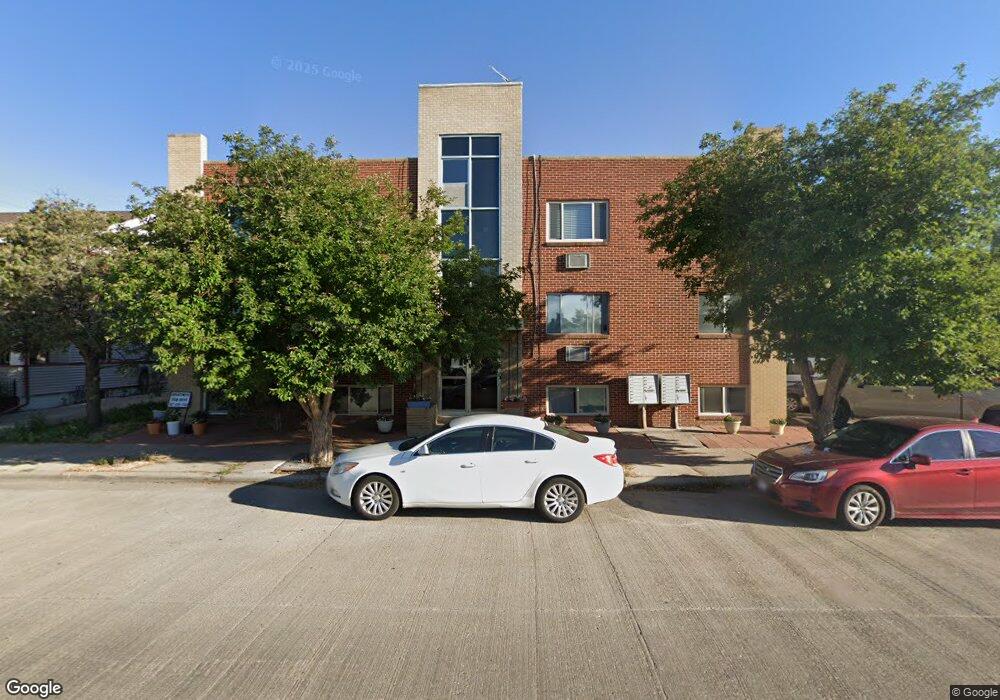
306 E 18th St Unit 203 Cheyenne, WY 82001
Historic Cheyenne NeighborhoodEstimated Value: $132,000 - $357,000
Studio
21
Baths
11,760
Sq Ft
$18/Sq Ft
Est. Value
About This Home
This home is located at 306 E 18th St Unit 203, Cheyenne, WY 82001 and is currently estimated at $206,425, approximately $17 per square foot. 306 E 18th St Unit 203 is a home located in Laramie County with nearby schools including Alta Vista Elementary School, Carey Junior High School, and East High School.
Ownership History
Date
Name
Owned For
Owner Type
Purchase Details
Closed on
Oct 14, 2024
Sold by
Munford Matthew and Renfro Rachel
Bought by
Diamond W Ranch Llc
Current Estimated Value
Purchase Details
Closed on
May 31, 2018
Sold by
Gbi Enterprises Llc
Bought by
Munford Matthew and Renfro Rachel
Home Financials for this Owner
Home Financials are based on the most recent Mortgage that was taken out on this home.
Original Mortgage
$108,000
Interest Rate
4.4%
Mortgage Type
Commercial
Purchase Details
Closed on
Jan 29, 2004
Sold by
Mccoy Martin E and Mccoy Nanette
Bought by
Gbi Enterprises Llc
Home Financials for this Owner
Home Financials are based on the most recent Mortgage that was taken out on this home.
Original Mortgage
$31,500
Interest Rate
5.79%
Mortgage Type
Purchase Money Mortgage
Purchase Details
Closed on
Oct 25, 1999
Sold by
Rogers Warner R
Bought by
Rogers Warner R and Rogers Pamela A
Create a Home Valuation Report for This Property
The Home Valuation Report is an in-depth analysis detailing your home's value as well as a comparison with similar homes in the area
Home Values in the Area
Average Home Value in this Area
Purchase History
| Date | Buyer | Sale Price | Title Company |
|---|---|---|---|
| Diamond W Ranch Llc | -- | First American | |
| Munford Matthew | -- | First American Title | |
| Gbi Enterprises Llc | -- | -- | |
| Mccoy Martin E | -- | -- | |
| Rogers Warner R | -- | -- |
Source: Public Records
Mortgage History
| Date | Status | Borrower | Loan Amount |
|---|---|---|---|
| Previous Owner | Munford Matthew | $108,000 | |
| Previous Owner | Mccoy Martin E | $31,500 |
Source: Public Records
Tax History
| Year | Tax Paid | Tax Assessment Tax Assessment Total Assessment is a certain percentage of the fair market value that is determined by local assessors to be the total taxable value of land and additions on the property. | Land | Improvement |
|---|---|---|---|---|
| 2025 | $420 | $5,285 | $169 | $5,116 |
| 2024 | $420 | $5,937 | $226 | $5,711 |
| 2023 | $423 | $5,981 | $226 | $5,755 |
| 2022 | $424 | $5,869 | $226 | $5,643 |
| 2021 | $290 | $4,008 | $226 | $3,782 |
| 2020 | $300 | $4,157 | $203 | $3,954 |
| 2019 | $274 | $3,796 | $203 | $3,593 |
| 2018 | $255 | $3,566 | $197 | $3,369 |
| 2017 | $230 | $3,191 | $197 | $2,994 |
| 2016 | $226 | $3,137 | $197 | $2,940 |
| 2015 | $218 | $3,023 | $197 | $2,826 |
| 2014 | $221 | $3,038 | $197 | $2,841 |
Source: Public Records
Map
Nearby Homes
- 306 E 18th St Unit 307
- 306 E 18th St Unit 102
- 1818 Evans Ave Unit 7
- 1510 Seymour Ave
- 414 E 22nd St
- TBD U S 30
- 701 E Lincolnway
- 802 E 18th St
- 714 E 15th St
- Diamond B Ranch Tract 9
- 521 W 17th St
- 1018 E 20th St
- 319 Hacienda Ct
- 1717 Alexander Ave Unit 302
- 1014 E 25th St Unit 203
- 305 E 28th St
- 301 W 10th St
- 601 W 25th St
- 2012 Snyder Ave
- 1406 E 19th St
- 306 E 18th St Unit 23
- 306 E 18th St Unit 24
- 306 E 18th St Unit 14
- 306 E 18th St Unit 308
- 306 E 18th St Unit 306
- 306 E 18th St Unit 305
- 306 E 18th St Unit 304
- 306 E 18th St Unit 303
- 306 E 18th St Unit 301
- 306 E 18th St Unit 208
- 306 E 18th St Unit 207
- 306 E 18th St Unit 206
- 306 E 18th St Unit 205
- 306 E 18th St Unit 204
- 306 E 18th St Unit 202
- 306 E 18th St Unit 201
- 306 E 18th St Unit 108
- 306 E 18th St Unit 107
- 306 E 18th St Unit 106
- 306 E 18th St Unit 101
Your Personal Tour Guide
Ask me questions while you tour the home.