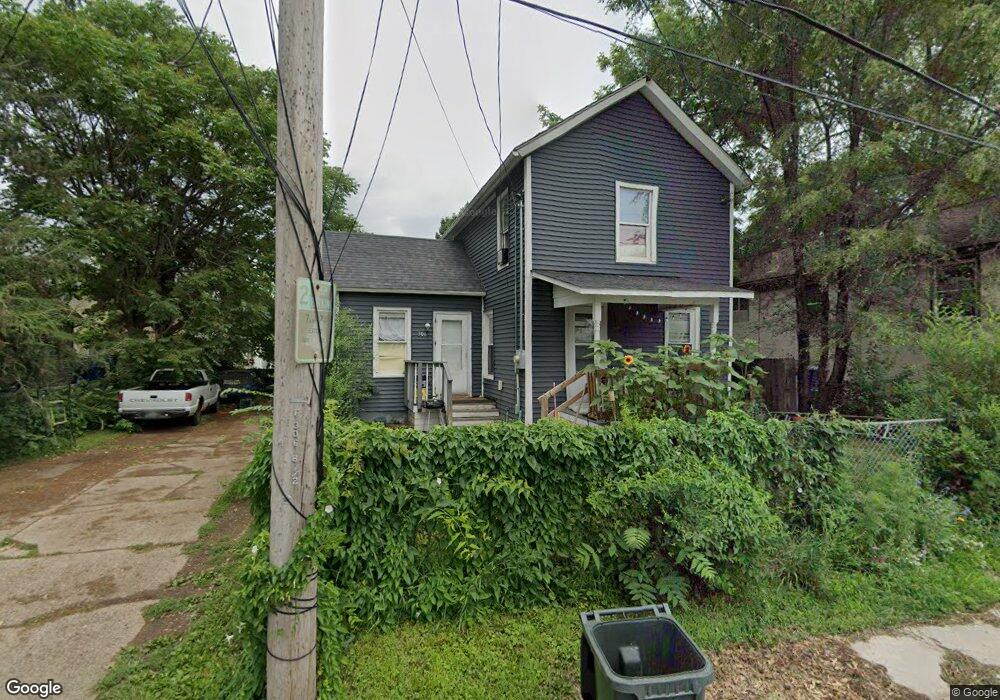
306 E 8 1/2 St Davenport, IA 52803
Central Davenport NeighborhoodEstimated Value: $56,000 - $101,000
2
Beds
1
Bath
931
Sq Ft
$82/Sq Ft
Est. Value
About This Home
This home is located at 306 E 8 1/2 St, Davenport, IA 52803 and is currently estimated at $76,523, approximately $82 per square foot. 306 E 8 1/2 St is a home located in Scott County with nearby schools including Madison Elementary School, Frank L. Smart Intermediate School, and Central High School.
Ownership History
Date
Name
Owned For
Owner Type
Purchase Details
Closed on
Feb 15, 2022
Sold by
Dolan Michael E and Dolan Natasha L
Bought by
Gray Line Holdings Llc
Current Estimated Value
Purchase Details
Closed on
Jul 27, 2021
Sold by
Mapes Georgia
Bought by
Gray Line Holdings Llc
Home Financials for this Owner
Home Financials are based on the most recent Mortgage that was taken out on this home.
Original Mortgage
$65,000
Interest Rate
2.93%
Mortgage Type
New Conventional
Purchase Details
Closed on
May 18, 2017
Sold by
Andrew Wold Investments Llc
Bought by
Aguirre Heather R and Ortega Manuel M
Purchase Details
Closed on
Jan 5, 2016
Sold by
Detiege Adrienne N
Bought by
Jpmorgan Chase Bank Na
Purchase Details
Closed on
Apr 26, 2010
Sold by
Weber Vincent and Weber Mary Lou
Bought by
Detiege Adrienne N and Legier Richard M
Create a Home Valuation Report for This Property
The Home Valuation Report is an in-depth analysis detailing your home's value as well as a comparison with similar homes in the area
Home Values in the Area
Average Home Value in this Area
Purchase History
| Date | Buyer | Sale Price | Title Company |
|---|---|---|---|
| Gray Line Holdings Llc | -- | None Listed On Document | |
| Gray Line Holdings Llc | $40,000 | None Listed On Document | |
| Aguirre Heather R | $69,000 | None Available | |
| Jpmorgan Chase Bank Na | -- | None Available | |
| Detiege Adrienne N | $17,500 | None Available |
Source: Public Records
Mortgage History
| Date | Status | Borrower | Loan Amount |
|---|---|---|---|
| Previous Owner | Gray Line Holdings Llc | $65,000 |
Source: Public Records
Tax History Compared to Growth
Tax History
| Year | Tax Paid | Tax Assessment Tax Assessment Total Assessment is a certain percentage of the fair market value that is determined by local assessors to be the total taxable value of land and additions on the property. | Land | Improvement |
|---|---|---|---|---|
| 2025 | $514 | $53,750 | $11,360 | $42,390 |
| 2024 | $713 | $28,740 | $11,360 | $17,380 |
| 2023 | $603 | $28,740 | $11,360 | $17,380 |
| 2022 | $683 | $18,380 | $5,450 | $12,930 |
| 2021 | $366 | $17,050 | $5,450 | $11,600 |
| 2020 | $616 | $12,050 | $5,450 | $6,600 |
| 2019 | $517 | $13,630 | $5,450 | $8,180 |
| 2018 | $1,491 | $13,630 | $5,450 | $8,180 |
| 2017 | $800 | $29,440 | $5,450 | $23,990 |
| 2016 | $864 | $29,440 | $0 | $0 |
| 2015 | $644 | $30,260 | $0 | $0 |
| 2014 | $672 | $30,260 | $0 | $0 |
| 2013 | $660 | $0 | $0 | $0 |
| 2012 | -- | $27,810 | $4,740 | $23,070 |
Source: Public Records
Map
Nearby Homes