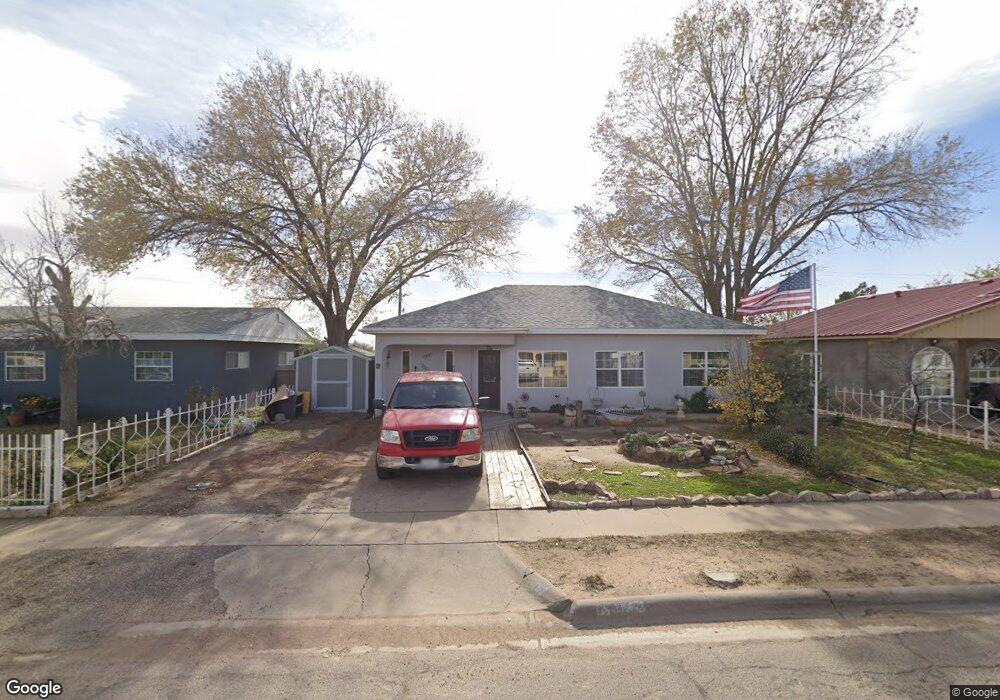
306 E Conner St Roswell, NM 88203
Estimated Value: $103,376 - $143,000
Studio
--
Bath
1,192
Sq Ft
$112/Sq Ft
Est. Value
About This Home
This home is located at 306 E Conner St, Roswell, NM 88203 and is currently estimated at $133,094, approximately $111 per square foot. 306 E Conner St is a home located in Chaves County with nearby schools including Monterrey Elementary School, Mountain View Middle School, and Roswell High School.
Ownership History
Date
Name
Owned For
Owner Type
Purchase Details
Closed on
Mar 20, 2023
Sold by
Melendez Mary Gonzales
Bought by
Alvarado Nayeli and Cano Kevven David
Current Estimated Value
Home Financials for this Owner
Home Financials are based on the most recent Mortgage that was taken out on this home.
Original Mortgage
$3,820
Outstanding Balance
$3,710
Interest Rate
6.6%
Estimated Equity
$129,384
Purchase Details
Closed on
Mar 9, 2023
Sold by
Melendez Mario
Bought by
Gonzales Melendez Mary
Home Financials for this Owner
Home Financials are based on the most recent Mortgage that was taken out on this home.
Original Mortgage
$3,820
Outstanding Balance
$3,710
Interest Rate
6.6%
Estimated Equity
$129,384
Purchase Details
Closed on
Mar 15, 2015
Sold by
Yates Martha E
Bought by
Jenner Angela
Create a Home Valuation Report for This Property
The Home Valuation Report is an in-depth analysis detailing your home's value as well as a comparison with similar homes in the area
Purchase History
| Date | Buyer | Sale Price | Title Company |
|---|---|---|---|
| Alvarado Nayeli | -- | Fidelity National Title | |
| Gonzales Melendez Mary | -- | Fidelity National Title | |
| Jenner Angela | -- | None Available |
Source: Public Records
Mortgage History
| Date | Status | Borrower | Loan Amount |
|---|---|---|---|
| Open | Alvarado Nayeli | $3,820 | |
| Open | Alvarado Nayeli | $93,769 |
Source: Public Records
Tax History Compared to Growth
Tax History
| Year | Tax Paid | Tax Assessment Tax Assessment Total Assessment is a certain percentage of the fair market value that is determined by local assessors to be the total taxable value of land and additions on the property. | Land | Improvement |
|---|---|---|---|---|
| 2025 | $512 | $19,400 | $1,161 | $18,239 |
| 2024 | $513 | $18,835 | $1,129 | $17,706 |
| 2023 | $513 | $18,286 | $1,100 | $17,186 |
| 2022 | $494 | $17,755 | $1,025 | $16,730 |
| 2021 | $490 | $17,238 | $961 | $16,277 |
| 2020 | $476 | $16,735 | $891 | $15,844 |
| 2019 | $461 | $16,248 | $816 | $15,432 |
| 2018 | $447 | $15,775 | $564 | $15,211 |
| 2017 | $430 | $15,316 | $564 | $14,752 |
| 2016 | $270 | $14,870 | $564 | $14,306 |
| 2015 | $282 | $14,437 | $564 | $13,873 |
| 2014 | $538 | $14,016 | $563 | $13,453 |
Source: Public Records
Map
Nearby Homes
- 00 SE Main St
- 000 SE Main St
- 2111 S Richardson Ave
- 2200 S Richardson Ave
- 5901 S Main St
- 5831 S Main St
- 2103 S Main St
- 5905 S Main St
- 8703 S Main St
- 2698 S Main St
- 1901 S Main St
- oooo Sapphire St
- 100 Blk Jaffa St
- 2706 W Onyx St
- 2708 S Onyx Dr
- 2710 W Onyx St
- 2800 W Onyx St
- 1915 S Pennsylvania Ave
- 2904 S Lea Ave
- 3104 S Lea Ave
- 308 E Conner St
- 304 E Conner St
- 310 E Conner St
- 302 E Conner St
- 303 E Conner St
- 305 E Conner St
- 301 E Conner St
- 312 E Conner St
- 307 E Conner St
- 300 E Conner St
- 219 E Conner St
- 309 E Conner St
- 314 E Conner St
- 218 E Conner St
- 217 E Conner St
- 311 E Conner St
- 300 E Hammond St
- 302 E Hammond St
- 216 E Conner St
- 316 E Conner St