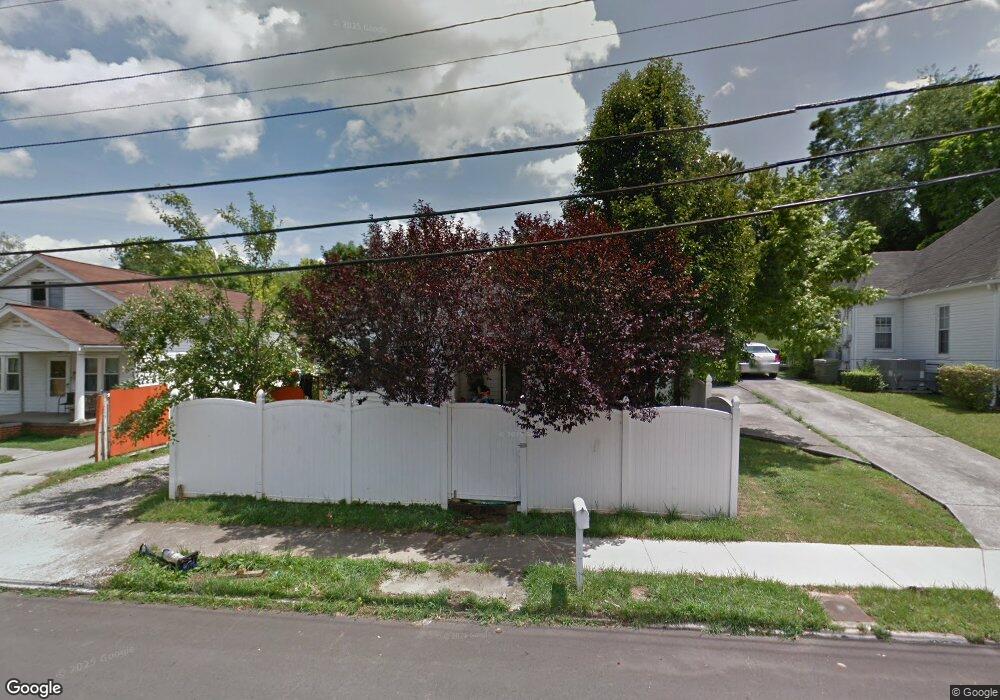
306 Inman St Morristown, TN 37813
Estimated Value: $144,561 - $211,000
--
Bed
2
Baths
1,177
Sq Ft
$148/Sq Ft
Est. Value
About This Home
This home is located at 306 Inman St, Morristown, TN 37813 and is currently estimated at $174,140, approximately $147 per square foot. 306 Inman St is a home located in Hamblen County with nearby schools including Hillcrest Elementary School, Meadowview Middle School, and Morristown East High School.
Ownership History
Date
Name
Owned For
Owner Type
Purchase Details
Closed on
Jun 17, 2008
Sold by
Taylor Faris K
Bought by
Portillo Arnulfo Javier Campos
Current Estimated Value
Home Financials for this Owner
Home Financials are based on the most recent Mortgage that was taken out on this home.
Original Mortgage
$73,717
Outstanding Balance
$47,086
Interest Rate
5.96%
Estimated Equity
$127,054
Purchase Details
Closed on
Feb 29, 2008
Sold by
Ball Mark Anthony
Bought by
Taylor Faris K
Home Financials for this Owner
Home Financials are based on the most recent Mortgage that was taken out on this home.
Original Mortgage
$42,000
Interest Rate
5.63%
Purchase Details
Closed on
Feb 13, 2008
Sold by
Layman Norma Watson
Bought by
Ball Mark Anthony
Home Financials for this Owner
Home Financials are based on the most recent Mortgage that was taken out on this home.
Original Mortgage
$42,000
Interest Rate
5.63%
Purchase Details
Closed on
Aug 12, 1991
Bought by
Bryant Samuel L and Bryant Ruby G
Purchase Details
Closed on
Nov 28, 1984
Bought by
Church Montvue Baptist
Create a Home Valuation Report for This Property
The Home Valuation Report is an in-depth analysis detailing your home's value as well as a comparison with similar homes in the area
Home Values in the Area
Average Home Value in this Area
Purchase History
| Date | Buyer | Sale Price | Title Company |
|---|---|---|---|
| Portillo Arnulfo Javier Campos | $74,300 | -- | |
| Taylor Faris K | $52,500 | -- | |
| Ball Mark Anthony | $50,000 | -- | |
| Bryant Samuel L | $22,500 | -- | |
| Church Montvue Baptist | $22,000 | -- |
Source: Public Records
Mortgage History
| Date | Status | Borrower | Loan Amount |
|---|---|---|---|
| Open | Church Montvue Baptist | $73,717 | |
| Previous Owner | Church Montvue Baptist | $42,000 |
Source: Public Records
Tax History Compared to Growth
Tax History
| Year | Tax Paid | Tax Assessment Tax Assessment Total Assessment is a certain percentage of the fair market value that is determined by local assessors to be the total taxable value of land and additions on the property. | Land | Improvement |
|---|---|---|---|---|
| 2024 | $337 | $19,175 | $3,625 | $15,550 |
| 2023 | $337 | $19,175 | $0 | $0 |
| 2022 | $605 | $19,175 | $3,625 | $15,550 |
| 2021 | $605 | $19,175 | $3,625 | $15,550 |
| 2020 | $605 | $19,175 | $3,625 | $15,550 |
| 2019 | $578 | $17,000 | $3,125 | $13,875 |
| 2018 | $536 | $17,000 | $3,125 | $13,875 |
| 2017 | $527 | $17,000 | $3,125 | $13,875 |
| 2016 | $503 | $17,000 | $3,125 | $13,875 |
| 2015 | $468 | $17,000 | $3,125 | $13,875 |
| 2014 | -- | $17,000 | $3,125 | $13,875 |
| 2013 | -- | $18,275 | $0 | $0 |
Source: Public Records
Map
Nearby Homes
- 219 Inman St
- 435 S Hill St
- 417 Cain Ave
- 712 Williams St
- 831 Cave St
- 323 Pauline Ave
- 915 Forgey Ave
- 811 Crescent St
- 207 E 2nd St N
- 2078 Edgewater Sound Rd
- 118 E 3rd St N
- 721 E 1st St N
- 721 E 1st North St
- 926 E Main St
- 0 S Liberty Hill Rd Unit 703697
- 819 Choctaw St
- 525 S Liberty Hill Rd
- 400 E 4th St N
- 816 Choctaw St
- 0 Joe Hall Rd Unit 703714