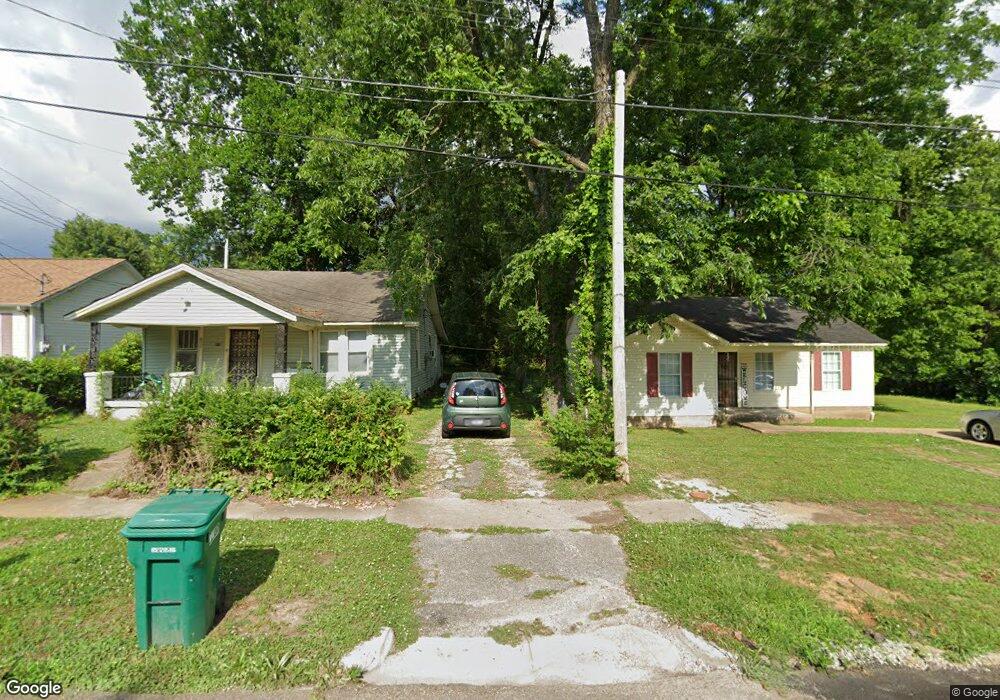
306 Laconte St Jackson, TN 38301
Downtown Jackson NeighborhoodEstimated Value: $76,000 - $109,000
3
Beds
2
Baths
1,008
Sq Ft
$95/Sq Ft
Est. Value
About This Home
This home is located at 306 Laconte St, Jackson, TN 38301 and is currently estimated at $95,731, approximately $94 per square foot. 306 Laconte St is a home located in Madison County with nearby schools including Lincoln Elementary School, North Parkway Middle School, and Liberty Technology Magnet High School.
Ownership History
Date
Name
Owned For
Owner Type
Purchase Details
Closed on
Mar 30, 2012
Bought by
Brv Properties Llc
Current Estimated Value
Purchase Details
Closed on
Feb 10, 2012
Sold by
Douglas Angela M
Bought by
Federal National Mtg Associati and O Fannie Mae C
Purchase Details
Closed on
Jul 17, 2003
Sold by
Ed Haltom
Bought by
Douglas Angela M
Home Financials for this Owner
Home Financials are based on the most recent Mortgage that was taken out on this home.
Original Mortgage
$60,000
Interest Rate
5.16%
Purchase Details
Closed on
Jan 8, 2003
Sold by
Irvin Smith
Bought by
Ed Haltom
Purchase Details
Closed on
Jan 7, 2002
Bought by
Haltom Ed
Purchase Details
Closed on
Apr 21, 1997
Sold by
Irvin Smith
Bought by
Emell Scales
Purchase Details
Closed on
Sep 10, 1984
Bought by
Smith Irvin
Create a Home Valuation Report for This Property
The Home Valuation Report is an in-depth analysis detailing your home's value as well as a comparison with similar homes in the area
Home Values in the Area
Average Home Value in this Area
Purchase History
| Date | Buyer | Sale Price | Title Company |
|---|---|---|---|
| Brv Properties Llc | $32,300 | -- | |
| Brv Properties Llc | $32,250 | -- | |
| Federal National Mtg Associati | $44,209 | -- | |
| Douglas Angela M | $61,900 | -- | |
| Ed Haltom | $2,500 | -- | |
| Haltom Ed | $2,500 | -- | |
| Emell Scales | -- | -- | |
| Smith Irvin | -- | -- |
Source: Public Records
Mortgage History
| Date | Status | Borrower | Loan Amount |
|---|---|---|---|
| Previous Owner | Smith Irvin | $60,000 |
Source: Public Records
Tax History Compared to Growth
Tax History
| Year | Tax Paid | Tax Assessment Tax Assessment Total Assessment is a certain percentage of the fair market value that is determined by local assessors to be the total taxable value of land and additions on the property. | Land | Improvement |
|---|---|---|---|---|
| 2024 | $387 | $20,650 | $1,075 | $19,575 |
| 2022 | $720 | $20,650 | $1,075 | $19,575 |
| 2021 | $712 | $16,525 | $950 | $15,575 |
| 2020 | $712 | $16,525 | $950 | $15,575 |
| 2019 | $712 | $16,525 | $950 | $15,575 |
| 2018 | $712 | $16,525 | $950 | $15,575 |
| 2017 | $704 | $15,975 | $950 | $15,025 |
| 2016 | $656 | $15,975 | $950 | $15,025 |
| 2015 | $657 | $15,975 | $950 | $15,025 |
| 2014 | $657 | $15,975 | $950 | $15,025 |
Source: Public Records
Map
Nearby Homes