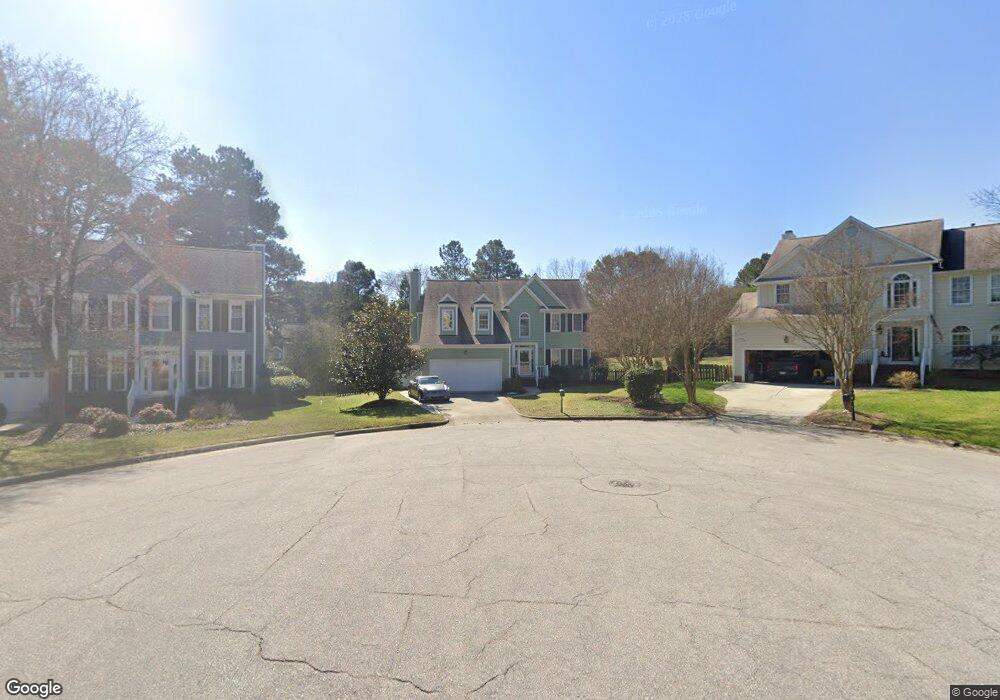
306 Lippershey Ct Cary, NC 27513
Preston NeighborhoodEstimated Value: $638,000 - $693,000
3
Beds
3
Baths
1,992
Sq Ft
$331/Sq Ft
Est. Value
About This Home
This home is located at 306 Lippershey Ct, Cary, NC 27513 and is currently estimated at $658,826, approximately $330 per square foot. 306 Lippershey Ct is a home located in Wake County with nearby schools including Weatherstone Elementary School, West Cary Middle School, and Green Hope High.
Ownership History
Date
Name
Owned For
Owner Type
Purchase Details
Closed on
Sep 26, 2023
Sold by
Gava Craig and Gava Elizabeth A
Bought by
Craig And Elizabeth Gava Trust and Gava
Current Estimated Value
Purchase Details
Closed on
Aug 7, 2007
Sold by
Biel Charles Anthony
Bought by
Gava Craig and Gava Elizabeth A
Home Financials for this Owner
Home Financials are based on the most recent Mortgage that was taken out on this home.
Original Mortgage
$234,800
Interest Rate
6.63%
Mortgage Type
Purchase Money Mortgage
Purchase Details
Closed on
Jul 27, 2006
Sold by
Biel Charles Anthony and Biel Tracy Appling
Bought by
Biel Charles Anthony
Home Financials for this Owner
Home Financials are based on the most recent Mortgage that was taken out on this home.
Original Mortgage
$14,200
Interest Rate
6.28%
Mortgage Type
Stand Alone Second
Create a Home Valuation Report for This Property
The Home Valuation Report is an in-depth analysis detailing your home's value as well as a comparison with similar homes in the area
Home Values in the Area
Average Home Value in this Area
Purchase History
| Date | Buyer | Sale Price | Title Company |
|---|---|---|---|
| Craig And Elizabeth Gava Trust | -- | None Listed On Document | |
| Gava Craig | $293,500 | None Available | |
| Biel Charles Anthony | -- | None Available |
Source: Public Records
Mortgage History
| Date | Status | Borrower | Loan Amount |
|---|---|---|---|
| Previous Owner | Gava Craig | $234,800 | |
| Previous Owner | Biel Charles Anthony | $14,200 | |
| Previous Owner | Biel Charles Anthony | $208,000 |
Source: Public Records
Tax History Compared to Growth
Tax History
| Year | Tax Paid | Tax Assessment Tax Assessment Total Assessment is a certain percentage of the fair market value that is determined by local assessors to be the total taxable value of land and additions on the property. | Land | Improvement |
|---|---|---|---|---|
| 2025 | $5,442 | $632,614 | $250,000 | $382,614 |
| 2024 | $5,324 | $632,614 | $250,000 | $382,614 |
| 2023 | $4,020 | $399,214 | $111,000 | $288,214 |
| 2022 | $3,870 | $399,214 | $111,000 | $288,214 |
| 2021 | $3,793 | $399,214 | $111,000 | $288,214 |
| 2020 | $3,813 | $399,214 | $111,000 | $288,214 |
| 2019 | $3,379 | $313,679 | $98,000 | $215,679 |
| 2018 | $3,171 | $313,679 | $98,000 | $215,679 |
| 2017 | $3,047 | $313,679 | $98,000 | $215,679 |
| 2016 | $3,002 | $313,679 | $98,000 | $215,679 |
| 2015 | $2,907 | $293,239 | $88,000 | $205,239 |
| 2014 | $2,741 | $293,239 | $88,000 | $205,239 |
Source: Public Records
Map
Nearby Homes
- 114 Council Gap Ct
- 104 Deerwalk Ct
- 119 Ethans Glen Ct
- 107 Ethans Glen Ct
- 217 Preston Retreat Ln
- 102 Fentress Ct
- 217 New Londondale Dr
- 112 Glen Abbey Dr
- 501 Riggsbee Farm Dr
- 205 Benwell Ct
- 111 N Coslett Ct
- 210 Gingergate Dr
- 111 Gingergate Dr
- 316 Arlington Ridge
- 121 Goldenthal Ct
- 116 Dallavia Ct
- 107 Ackworth Ct
- 120 Harmony Hill Ln
- 324 Farrow Glen Loop
- 901 Crabtree Crossing Pkwy
- 304 Lippershey Ct
- 308 Lippershey Ct
- 107 Council Gap Ct
- 109 Council Gap Ct
- 103 Deerwalk Ct
- 105 Council Gap Ct
- 310 Lippershey Ct
- 111 Council Gap Ct
- 302 Lippershey Ct
- 105 Deerwalk Ct
- 103 Council Gap Ct
- 113 Council Gap Ct
- 307 Lippershey Ct
- 312 Lippershey Ct
- 101 Halpen Dr
- 305 Lippershey Ct
- 110 Council Gap Ct
- 115 Council Gap Ct
- 108 Deerwalk Ct
- 400 Lippershey Ct