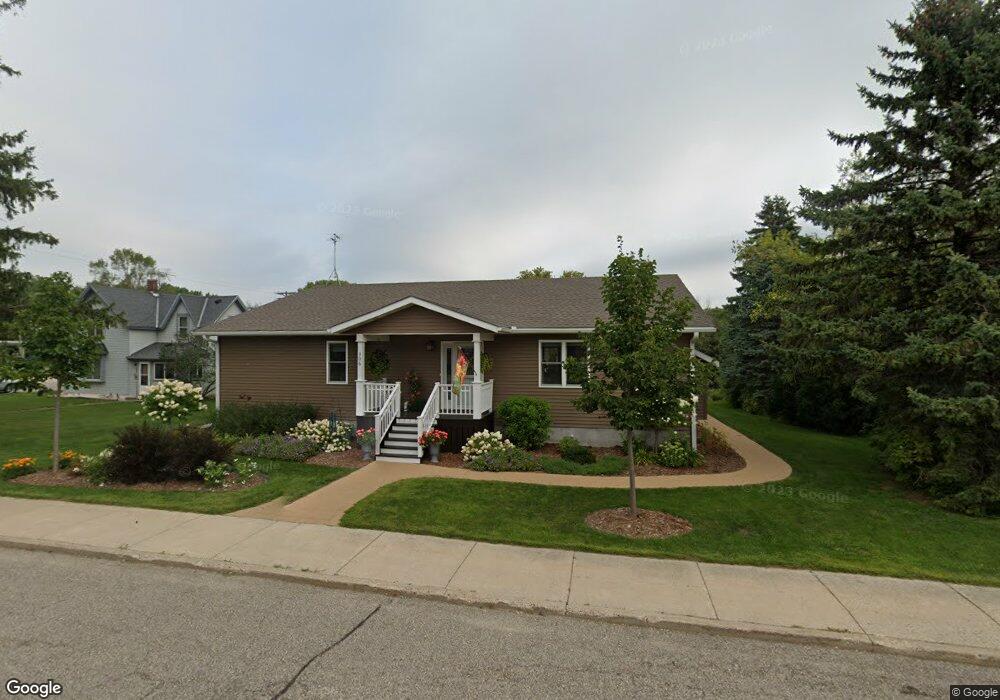
306 Main St Nerstrand, MN 55053
Estimated Value: $225,000 - $380,500
2
Beds
1
Bath
1,600
Sq Ft
$197/Sq Ft
Est. Value
About This Home
This home is located at 306 Main St, Nerstrand, MN 55053 and is currently estimated at $314,875, approximately $196 per square foot. 306 Main St is a home located in Rice County with nearby schools including Roosevelt Elementary School, Faribault Middle School, and Faribault Senior High School.
Ownership History
Date
Name
Owned For
Owner Type
Purchase Details
Closed on
Sep 19, 2018
Sold by
Gustafson Chad E and Rojas Jeimmy Yusty
Bought by
Wille Steven A and Wille Debra A
Current Estimated Value
Purchase Details
Closed on
Aug 23, 2010
Sold by
Citifinancial Services Inc
Bought by
Gustafson Lewayne O
Purchase Details
Closed on
Jun 3, 2005
Sold by
Douglas Jeanne M
Bought by
Spaeth Nicole C
Purchase Details
Closed on
Aug 13, 2003
Sold by
Hobbs Bryan J
Bought by
Douglas Jeanne M
Create a Home Valuation Report for This Property
The Home Valuation Report is an in-depth analysis detailing your home's value as well as a comparison with similar homes in the area
Purchase History
| Date | Buyer | Sale Price | Title Company |
|---|---|---|---|
| Wille Steven A | $15,000 | None Available | |
| Gustafson Lewayne O | $25,000 | -- | |
| Spaeth Nicole C | $112,000 | -- | |
| Douglas Jeanne M | $74,000 | -- |
Source: Public Records
Tax History
| Year | Tax Paid | Tax Assessment Tax Assessment Total Assessment is a certain percentage of the fair market value that is determined by local assessors to be the total taxable value of land and additions on the property. | Land | Improvement |
|---|---|---|---|---|
| 2025 | $3,582 | $367,600 | $58,800 | $308,800 |
| 2024 | $3,582 | $317,000 | $49,000 | $268,000 |
| 2023 | $3,388 | $317,000 | $49,000 | $268,000 |
| 2022 | $3,058 | $284,600 | $45,100 | $239,500 |
| 2021 | $2,980 | $248,700 | $39,200 | $209,500 |
| 2020 | $362 | $244,400 | $39,200 | $205,200 |
| 2019 | $512 | $39,000 | $31,400 | $7,600 |
| 2018 | $526 | $38,300 | $31,400 | $6,900 |
| 2017 | $60 | $38,400 | $31,400 | $7,000 |
| 2016 | $516 | $38,400 | $31,400 | $7,000 |
| 2015 | $498 | $36,400 | $29,800 | $6,600 |
| 2014 | -- | $38,800 | $36,100 | $2,700 |
Source: Public Records
Map
Nearby Homes
Your Personal Tour Guide
Ask me questions while you tour the home.