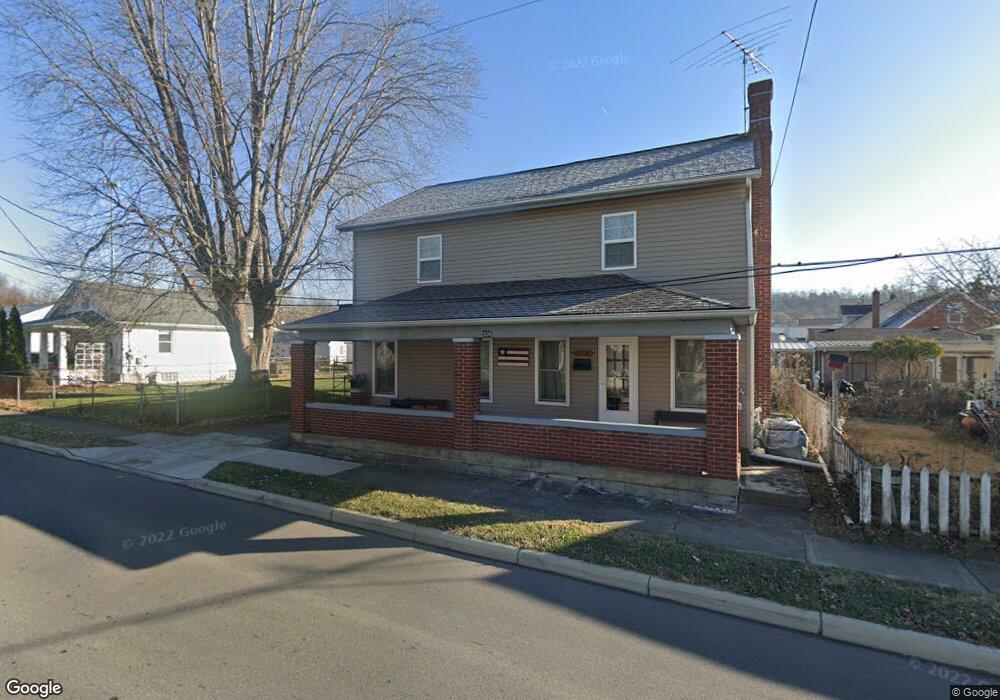
306 N Hill St Harrison, OH 45030
Estimated Value: $219,971 - $268,000
4
Beds
2
Baths
1,630
Sq Ft
$155/Sq Ft
Est. Value
About This Home
This home is located at 306 N Hill St, Harrison, OH 45030 and is currently estimated at $252,493, approximately $154 per square foot. 306 N Hill St is a home located in Hamilton County with nearby schools including William Henry Harrison High School, St. John The Baptist School, and Summit Academy of Southwest Ohio.
Ownership History
Date
Name
Owned For
Owner Type
Purchase Details
Closed on
Sep 29, 2021
Sold by
Wesley Charles E
Bought by
Wesley Charles E and Wesley Deborah A
Current Estimated Value
Purchase Details
Closed on
Jun 4, 2003
Sold by
Wesley Charles E and Wesley Pamela M
Bought by
Wesley Charles E
Home Financials for this Owner
Home Financials are based on the most recent Mortgage that was taken out on this home.
Original Mortgage
$108,000
Outstanding Balance
$44,055
Interest Rate
5.3%
Mortgage Type
Unknown
Estimated Equity
$208,438
Purchase Details
Closed on
Dec 1, 1994
Sold by
Wesley Fred D and Wesley Jarrett
Bought by
Wesley Charles E and Wesley Pamela M
Home Financials for this Owner
Home Financials are based on the most recent Mortgage that was taken out on this home.
Original Mortgage
$61,000
Interest Rate
9.06%
Create a Home Valuation Report for This Property
The Home Valuation Report is an in-depth analysis detailing your home's value as well as a comparison with similar homes in the area
Home Values in the Area
Average Home Value in this Area
Purchase History
| Date | Buyer | Sale Price | Title Company |
|---|---|---|---|
| Wesley Charles E | -- | None Available | |
| Wesley Charles E | -- | -- | |
| Wesley Charles E | -- | -- |
Source: Public Records
Mortgage History
| Date | Status | Borrower | Loan Amount |
|---|---|---|---|
| Open | Wesley Charles E | $108,000 | |
| Closed | Wesley Charles E | $61,000 |
Source: Public Records
Tax History
| Year | Tax Paid | Tax Assessment Tax Assessment Total Assessment is a certain percentage of the fair market value that is determined by local assessors to be the total taxable value of land and additions on the property. | Land | Improvement |
|---|---|---|---|---|
| 2025 | $2,527 | $56,442 | $12,198 | $44,244 |
| 2023 | $2,536 | $56,442 | $12,198 | $44,244 |
| 2022 | $1,984 | $38,689 | $11,459 | $27,230 |
| 2021 | $2,066 | $38,689 | $11,459 | $27,230 |
| 2020 | $2,039 | $38,689 | $11,459 | $27,230 |
| 2019 | $1,785 | $32,239 | $9,548 | $22,691 |
| 2018 | $1,794 | $32,239 | $9,548 | $22,691 |
| 2017 | $1,715 | $32,239 | $9,548 | $22,691 |
| 2016 | $1,460 | $29,222 | $9,072 | $20,150 |
| 2015 | $1,456 | $29,222 | $9,072 | $20,150 |
| 2014 | $1,389 | $29,222 | $9,072 | $20,150 |
| 2013 | $1,472 | $30,758 | $9,548 | $21,210 |
Source: Public Records
Map
Nearby Homes
- 219 N Walnut St
- 119 Park Ave
- 10419 New Biddinger Rd
- 163 Turner Ridge Dr
- 157 Turner Ridge Dr
- 155 Turner Ridge Dr
- 23 Harrison Brookville Rd
- 11136 New Biddinger Rd
- 1111 Westfield Dr
- 10630 New Biddinger Rd
- 10638 New Biddinger Rd
- 10648 New Biddinger Rd
- 10655 New Biddinger Rd
- 207 Biddle Ave
- 107 Westfield Dr
- 117 Westfield Dr
- 120 Westfield Dr
- 143 Flintstone Dr
- 10485 New Biddinger Rd
- 483 Heritage Square
Your Personal Tour Guide
Ask me questions while you tour the home.