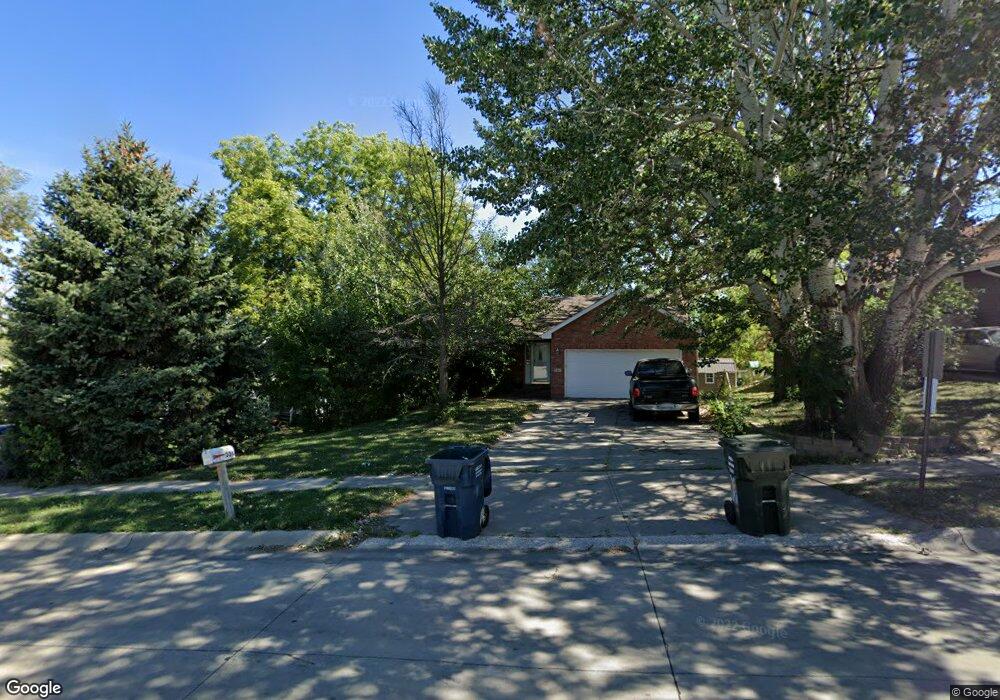
306 N Mc Kenna Ave Gretna, NE 68028
Estimated Value: $276,000 - $361,000
2
Beds
2
Baths
998
Sq Ft
$306/Sq Ft
Est. Value
About This Home
This home is located at 306 N Mc Kenna Ave, Gretna, NE 68028 and is currently estimated at $305,005, approximately $305 per square foot. 306 N Mc Kenna Ave is a home located in Sarpy County with nearby schools including Gretna Elementary School, Gretna Middle School, and Gretna High School.
Ownership History
Date
Name
Owned For
Owner Type
Purchase Details
Closed on
Jun 11, 2010
Sold by
Covolik Robert E
Bought by
Reis Bradley R
Current Estimated Value
Home Financials for this Owner
Home Financials are based on the most recent Mortgage that was taken out on this home.
Original Mortgage
$143,350
Outstanding Balance
$95,126
Interest Rate
4.77%
Estimated Equity
$209,879
Purchase Details
Closed on
Jul 10, 2007
Sold by
Covolik Susan D
Bought by
Covolik Robert E
Purchase Details
Closed on
Nov 28, 2005
Sold by
Vandenbroucke Casey C
Bought by
Covolik Robert E and Covolik Susan D
Purchase Details
Closed on
Oct 19, 2001
Sold by
Krambeck Fred
Bought by
Vandenbroucke Casey C
Purchase Details
Closed on
Aug 1, 2001
Sold by
Mcfarling A George and Mcfarling Jeanette R
Bought by
Krambeck Fred
Purchase Details
Closed on
Feb 2, 2001
Sold by
Krambeck Fred
Bought by
Mcfarling A George and Mcfarling Jeanette R
Create a Home Valuation Report for This Property
The Home Valuation Report is an in-depth analysis detailing your home's value as well as a comparison with similar homes in the area
Home Values in the Area
Average Home Value in this Area
Purchase History
| Date | Buyer | Sale Price | Title Company |
|---|---|---|---|
| Reis Bradley R | $140,000 | Dri Title & Escrow | |
| Covolik Robert E | -- | None Available | |
| Covolik Robert E | $150,000 | -- | |
| Vandenbroucke Casey C | $18,000 | Dakota Title & Escrow Co | |
| Krambeck Fred | $20,000 | Dakota Title & Escrow Co | |
| Mcfarling A George | $20,000 | Dakota Title & Escrow Co |
Source: Public Records
Mortgage History
| Date | Status | Borrower | Loan Amount |
|---|---|---|---|
| Open | Reis Bradley R | $143,350 |
Source: Public Records
Tax History Compared to Growth
Tax History
| Year | Tax Paid | Tax Assessment Tax Assessment Total Assessment is a certain percentage of the fair market value that is determined by local assessors to be the total taxable value of land and additions on the property. | Land | Improvement |
|---|---|---|---|---|
| 2025 | $4,917 | $316,864 | $40,500 | $276,364 |
| 2024 | $5,621 | $276,076 | $40,500 | $235,576 |
| 2023 | $5,621 | $261,496 | $40,500 | $220,996 |
| 2022 | $5,289 | $231,786 | $40,500 | $191,286 |
| 2021 | $4,775 | $211,624 | $40,500 | $171,124 |
| 2020 | $4,554 | $202,967 | $27,000 | $175,967 |
| 2019 | $4,145 | $184,997 | $30,000 | $154,997 |
| 2018 | $4,078 | $182,843 | $19,000 | $163,843 |
| 2017 | $3,905 | $174,869 | $19,000 | $155,869 |
| 2016 | $3,768 | $169,168 | $19,000 | $150,168 |
| 2015 | $3,512 | $158,993 | $19,000 | $139,993 |
| 2014 | $3,415 | $155,922 | $19,000 | $136,922 |
| 2012 | -- | $150,991 | $19,000 | $131,991 |
Source: Public Records
Map
Nearby Homes
- 419 Highland Dr
- 11303 S 210th Ave
- 347 Michael Dr
- 21733 Parkview Dr
- 21710 Parkview Dr
- 21603 Parkview Dr
- 710 Pawnee Dr
- 21605 Hackberry Dr
- Lot 136 W Gruenther Rd
- Lot 80 W Gruenther Rd
- Lot 71 W Gruenther Rd
- 21906 Amber Dr
- 21702 Amber Dr
- 21726 Amber Dr
- 21719 Amber Dr
- 21715 Amber Dr
- 11237 S 217th St
- 21859 Amber Cir
- 21858 Amber Cir
- 21855 Amber Cir
- 306 N Mckenna Ave
- 304 N Mc Kenna Ave
- 308 N Mc Kenna Ave
- 304 N Mckenna Ave
- 405 N Mc Kenna Ave
- 222 N Mc Kenna Ave
- 602 W Westplains Rd
- 227 N Mc Kenna Ave
- 305 N Mc Kenna Ave
- 408 N Mc Kenna Ave
- 407 N Mc Kenna Ave
- 604 W Westplains Rd Unit G
- 604 W Westplains Rd
- 725 Burns Place
- 729 Burns Place
- 409 N Mckenna Ave
- 733 Burns Place
- 409 N Mc Kenna Ave
- 410 N Mc Kenna Ave
- 600 W Westplains Rd