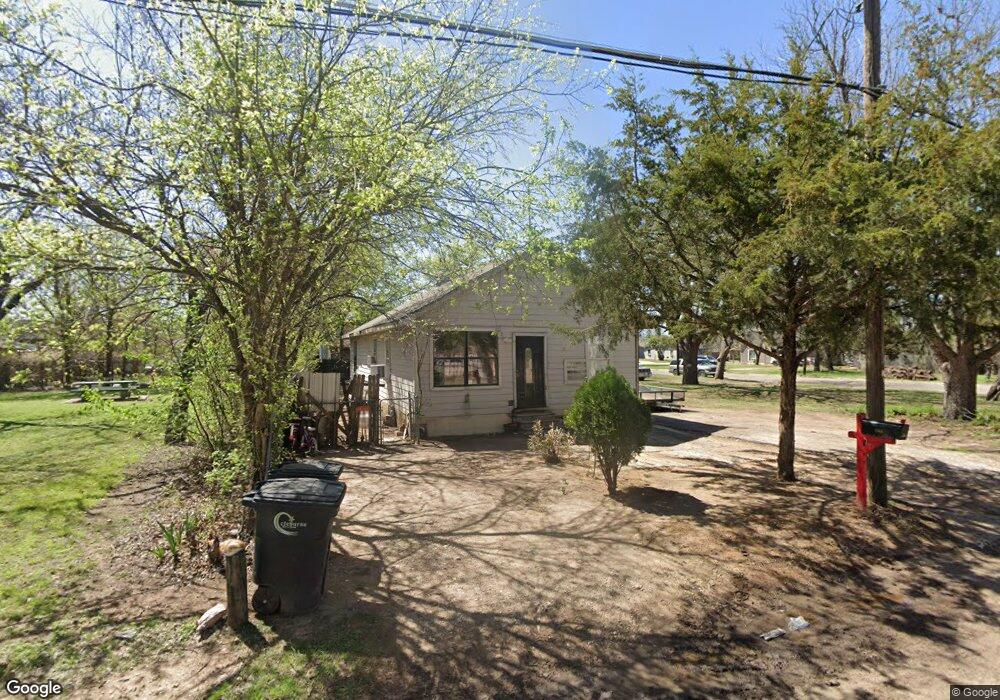
306 Robbins St Cleburne, TX 76031
Estimated Value: $169,517 - $273,000
3
Beds
1
Bath
1,300
Sq Ft
$169/Sq Ft
Est. Value
About This Home
This home is located at 306 Robbins St, Cleburne, TX 76031 and is currently estimated at $219,379, approximately $168 per square foot. 306 Robbins St is a home located in Johnson County with nearby schools including Santa Fe Elementary School, Lowell Smith Jr. Middle School, and Cleburne High School.
Ownership History
Date
Name
Owned For
Owner Type
Purchase Details
Closed on
Jan 26, 2024
Sold by
Galvan Gonzalo Martinez
Bought by
Martinez Jesica Nayeli
Current Estimated Value
Purchase Details
Closed on
Jan 4, 2024
Sold by
Torres Noemi and Belmarez Amy
Bought by
Martinez Jesica Nayeli
Create a Home Valuation Report for This Property
The Home Valuation Report is an in-depth analysis detailing your home's value as well as a comparison with similar homes in the area
Home Values in the Area
Average Home Value in this Area
Purchase History
| Date | Buyer | Sale Price | Title Company |
|---|---|---|---|
| Martinez Jesica Nayeli | -- | None Listed On Document | |
| Martinez Jesica Nayeli | -- | None Listed On Document |
Source: Public Records
Tax History
| Year | Tax Paid | Tax Assessment Tax Assessment Total Assessment is a certain percentage of the fair market value that is determined by local assessors to be the total taxable value of land and additions on the property. | Land | Improvement |
|---|---|---|---|---|
| 2025 | $1,761 | $136,551 | $43,000 | $93,551 |
| 2024 | $3,071 | $137,743 | $43,000 | $94,743 |
| 2023 | $2,631 | $118,243 | $23,500 | $94,743 |
| 2022 | $2,959 | $118,243 | $23,500 | $94,743 |
| 2021 | $3,085 | $118,243 | $23,500 | $94,743 |
| 2020 | $1,071 | $38,657 | $10,000 | $28,657 |
| 2019 | $1,142 | $38,657 | $10,000 | $28,657 |
| 2018 | $1,496 | $50,593 | $7,000 | $43,593 |
| 2017 | $1,489 | $50,593 | $7,000 | $43,593 |
| 2016 | $1,489 | $50,593 | $7,000 | $43,593 |
| 2015 | $1,114 | $50,593 | $7,000 | $43,593 |
| 2014 | $1,114 | $52,008 | $7,500 | $44,508 |
Source: Public Records
Map
Nearby Homes
- 603 E Willingham St
- 601 E Willingham St
- 731 E Brown St
- 605 Olive St
- 407 E Willingham St
- 821 E Brown St
- 715 N Border St
- 1101 N Border St
- 1300 N Brazos Ave
- 707 N Wilhite St
- 419 E Henderson St
- 709 N Wilhite St Unit 711
- 416 N Anglin St
- 938 E Henderson St
- 426 Sabine Ave
- 433 Sabine Ave
- 109 N Kouns St
- 201 Grandview St
- 430 Sabine Ave
- 717 N Robinson St
Your Personal Tour Guide
Ask me questions while you tour the home.