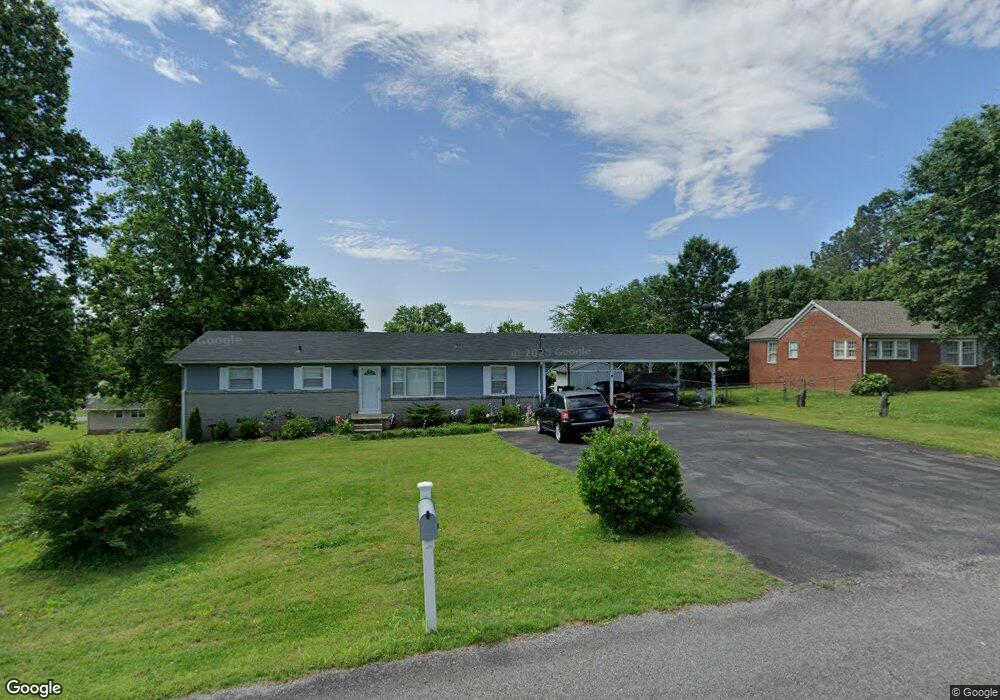
306 Scenic Dr Shelbyville, TN 37160
Estimated Value: $208,000 - $310,000
--
Bed
2
Baths
1,500
Sq Ft
$169/Sq Ft
Est. Value
About This Home
This home is located at 306 Scenic Dr, Shelbyville, TN 37160 and is currently estimated at $253,769, approximately $169 per square foot. 306 Scenic Dr is a home located in Bedford County with nearby schools including South Side Elementary School, Harris Middle School, and Christian Chapel Academy.
Ownership History
Date
Name
Owned For
Owner Type
Purchase Details
Closed on
Jul 31, 2024
Sold by
Carroll-Vinson Laurie June and Carroll Sonia Renee
Bought by
Johnson Equities Inc
Current Estimated Value
Home Financials for this Owner
Home Financials are based on the most recent Mortgage that was taken out on this home.
Original Mortgage
$120,000
Outstanding Balance
$118,531
Interest Rate
6.86%
Mortgage Type
New Conventional
Estimated Equity
$135,238
Purchase Details
Closed on
Oct 24, 1967
Bought by
Carroll Avery and Carroll June
Create a Home Valuation Report for This Property
The Home Valuation Report is an in-depth analysis detailing your home's value as well as a comparison with similar homes in the area
Home Values in the Area
Average Home Value in this Area
Purchase History
| Date | Buyer | Sale Price | Title Company |
|---|---|---|---|
| Johnson Equities Inc | $150,000 | Structure Title | |
| Johnson Equities Inc | $150,000 | Structure Title | |
| Carroll Avery | -- | -- |
Source: Public Records
Mortgage History
| Date | Status | Borrower | Loan Amount |
|---|---|---|---|
| Open | Johnson Equities Inc | $120,000 | |
| Closed | Johnson Equities Inc | $120,000 |
Source: Public Records
Tax History Compared to Growth
Tax History
| Year | Tax Paid | Tax Assessment Tax Assessment Total Assessment is a certain percentage of the fair market value that is determined by local assessors to be the total taxable value of land and additions on the property. | Land | Improvement |
|---|---|---|---|---|
| 2025 | -- | $33,650 | $0 | $0 |
| 2024 | -- | $33,650 | $5,625 | $28,025 |
| 2023 | $1,280 | $33,650 | $5,625 | $28,025 |
| 2022 | $1,317 | $33,650 | $5,625 | $28,025 |
| 2021 | $1,196 | $33,650 | $5,625 | $28,025 |
| 2020 | $1,004 | $33,650 | $5,625 | $28,025 |
| 2019 | $1,004 | $22,675 | $3,750 | $18,925 |
| 2018 | $981 | $22,675 | $3,750 | $18,925 |
| 2017 | $981 | $22,675 | $3,750 | $18,925 |
| 2016 | $973 | $22,675 | $3,750 | $18,925 |
| 2015 | $973 | $22,675 | $3,750 | $18,925 |
| 2014 | $812 | $20,703 | $0 | $0 |
Source: Public Records
Map
Nearby Homes