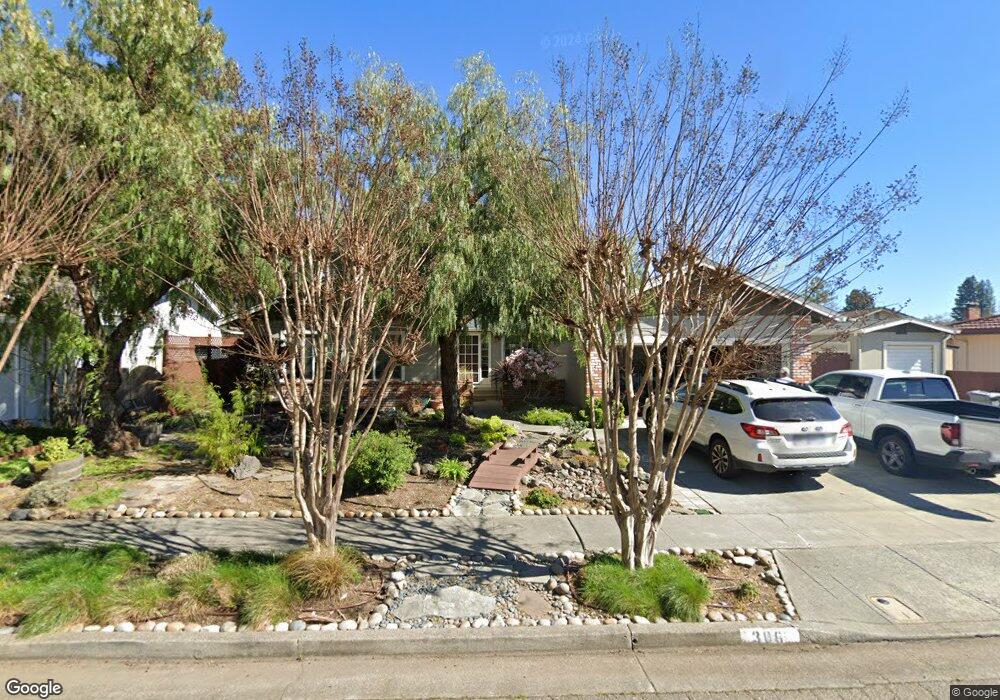
306 Simone Place N Santa Rosa, CA 95409
Estimated Value: $765,664 - $830,000
3
Beds
2
Baths
1,792
Sq Ft
$442/Sq Ft
Est. Value
About This Home
This home is located at 306 Simone Place N, Santa Rosa, CA 95409 and is currently estimated at $792,166, approximately $442 per square foot. 306 Simone Place N is a home located in Sonoma County with nearby schools including Sequoia Elementary School, Rincon Valley Middle School, and Maria Carrillo High School.
Ownership History
Date
Name
Owned For
Owner Type
Purchase Details
Closed on
Nov 23, 2010
Sold by
Sallee Stephen A and Sallee Celeste
Bought by
Sallee Stephen A and Sallee Celeste
Current Estimated Value
Home Financials for this Owner
Home Financials are based on the most recent Mortgage that was taken out on this home.
Original Mortgage
$130,000
Outstanding Balance
$85,334
Interest Rate
4.17%
Mortgage Type
New Conventional
Estimated Equity
$706,832
Purchase Details
Closed on
Mar 10, 2005
Sold by
Sallee Stephen A and Sallee Celeste
Bought by
Sallee Stephen A and Sallee Celeste
Purchase Details
Closed on
Mar 7, 1994
Sold by
Miller Richard R and Miller Marcia W
Bought by
Sallee Stephen A and Sallee Celeste
Home Financials for this Owner
Home Financials are based on the most recent Mortgage that was taken out on this home.
Original Mortgage
$122,000
Interest Rate
7%
Create a Home Valuation Report for This Property
The Home Valuation Report is an in-depth analysis detailing your home's value as well as a comparison with similar homes in the area
Home Values in the Area
Average Home Value in this Area
Purchase History
| Date | Buyer | Sale Price | Title Company |
|---|---|---|---|
| Sallee Stephen A | -- | Fidelity Natl Title Co | |
| Sallee Stephen A | -- | Fidelity National Title Co | |
| Sallee Stephen A | -- | -- | |
| Sallee Stephen A | $170,000 | North American Title Co Inc |
Source: Public Records
Mortgage History
| Date | Status | Borrower | Loan Amount |
|---|---|---|---|
| Open | Sallee Stephen A | $130,000 | |
| Closed | Sallee Stephen A | $122,000 |
Source: Public Records
Tax History Compared to Growth
Tax History
| Year | Tax Paid | Tax Assessment Tax Assessment Total Assessment is a certain percentage of the fair market value that is determined by local assessors to be the total taxable value of land and additions on the property. | Land | Improvement |
|---|---|---|---|---|
| 2025 | $3,221 | $285,939 | $109,326 | $176,613 |
| 2024 | $3,221 | $280,333 | $107,183 | $173,150 |
| 2023 | $3,221 | $274,837 | $105,082 | $169,755 |
| 2022 | $3,077 | $269,449 | $103,022 | $166,427 |
| 2021 | $3,014 | $264,166 | $101,002 | $163,164 |
| 2020 | $3,003 | $261,458 | $99,967 | $161,491 |
| 2019 | $2,973 | $256,332 | $98,007 | $158,325 |
| 2018 | $2,952 | $251,307 | $96,086 | $155,221 |
| 2017 | $2,897 | $246,380 | $94,202 | $152,178 |
| 2016 | $2,858 | $241,550 | $92,355 | $149,195 |
| 2015 | $2,772 | $237,922 | $90,968 | $146,954 |
| 2014 | $2,671 | $233,263 | $89,187 | $144,076 |
Source: Public Records
Map
Nearby Homes
- 305 Simone Place N
- 405 Simi Place
- 5056 Fravel Ln
- 537 Emerald Park Ct
- 311 Algiers Ct
- 5015 Charmian Dr
- 416 Tanglewood Ct
- 5086 Charmian Dr
- 5201 San Luis Ave
- 66 Coronado Cir
- 5209 San Luis Ave
- 61 Coronado Cir
- 5518 Marit Dr
- 5020 Roma St
- 5088 Firestone Ct
- 206 Indian Creek Dr
- 29 Coronado Cir
- 615 Montclair Dr
- 5025 Parkhurst Dr
- 184 El Encanto Way
- 312 Simone Place N
- 324 Simone Place N
- 5101 Lisa Way
- 309 Simone Place N
- 328 Simone Place N
- 5135 Lisa Way
- 301 Simone Place N
- 313 Simone Place N
- 321 Simone Place N
- 325 Simone Place N
- 5100 Lisa Way
- 332 Simone Place N
- 329 Simone Place N
- 317 Simone Place N
- 5145 Lisa Way
- 5120 Lisa Way
- 221 Simone Place S
- 333 Simone Place N
- 216 Simone Place S
- 5140 Lisa Way