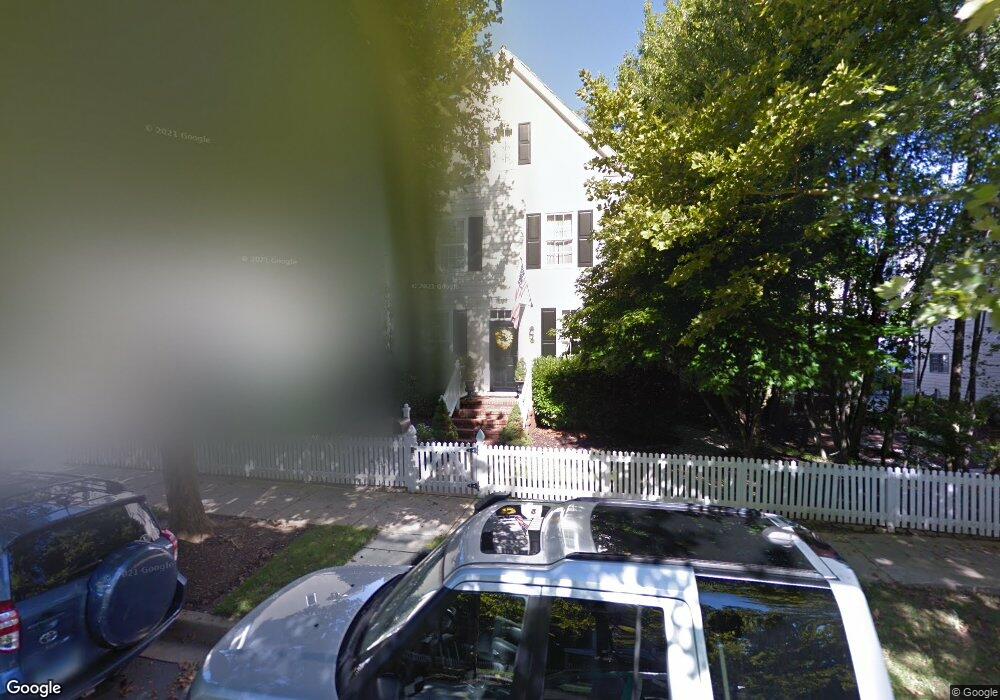
306 Tschiffely Square Rd Gaithersburg, MD 20878
Kentlands NeighborhoodEstimated Value: $996,000 - $1,147,000
Studio
5
Baths
1,728
Sq Ft
$616/Sq Ft
Est. Value
About This Home
This home is located at 306 Tschiffely Square Rd, Gaithersburg, MD 20878 and is currently estimated at $1,064,918, approximately $616 per square foot. 306 Tschiffely Square Rd is a home located in Montgomery County with nearby schools including Rachel Carson Elementary School, Lakelands Park Middle School, and Quince Orchard High School.
Ownership History
Date
Name
Owned For
Owner Type
Purchase Details
Closed on
Jun 13, 2005
Sold by
Helgerson Ronald N Et Al Tr
Bought by
Williams Jeffery S and Williams Meredith M
Current Estimated Value
Purchase Details
Closed on
May 31, 2005
Sold by
Helgerson Ronald N Et Al Tr
Bought by
Williams Jeffery S and Williams Meredith M
Purchase Details
Closed on
Feb 12, 2004
Sold by
Helgerson Ronald N
Bought by
Helgerson Ronald N Et Al Tr
Purchase Details
Closed on
Mar 28, 2002
Sold by
Hill Friedman and Hill Ernest
Bought by
Helgerson Ronald N
Purchase Details
Closed on
Oct 16, 1998
Sold by
R James C and R Dolan M
Bought by
Friedman Ernest and Friedman S
Create a Home Valuation Report for This Property
The Home Valuation Report is an in-depth analysis detailing your home's value as well as a comparison with similar homes in the area
Home Values in the Area
Average Home Value in this Area
Purchase History
| Date | Buyer | Sale Price | Title Company |
|---|---|---|---|
| Williams Jeffery S | $700,000 | -- | |
| Williams Jeffery S | $700,000 | -- | |
| Helgerson Ronald N Et Al Tr | -- | -- | |
| Helgerson Ronald N Et Al Tr | -- | -- | |
| Helgerson Ronald N | $425,000 | -- | |
| Friedman Ernest | $295,000 | -- |
Source: Public Records
Tax History
| Year | Tax Paid | Tax Assessment Tax Assessment Total Assessment is a certain percentage of the fair market value that is determined by local assessors to be the total taxable value of land and additions on the property. | Land | Improvement |
|---|---|---|---|---|
| 2025 | $10,657 | $839,500 | -- | -- |
| 2024 | $10,657 | $798,200 | $0 | $0 |
| 2023 | $10,755 | $756,900 | $418,700 | $338,200 |
| 2022 | $8,982 | $746,433 | $0 | $0 |
| 2021 | $8,719 | $735,967 | $0 | $0 |
| 2020 | $8,719 | $725,500 | $418,700 | $306,800 |
| 2019 | $8,624 | $718,300 | $0 | $0 |
| 2018 | $8,565 | $711,100 | $0 | $0 |
| 2017 | $8,589 | $703,900 | $0 | $0 |
| 2016 | -- | $661,033 | $0 | $0 |
| 2015 | $8,236 | $618,167 | $0 | $0 |
| 2014 | $8,236 | $575,300 | $0 | $0 |
Source: Public Records
Map
Nearby Homes
- 306 Beckwith St
- 55 Timber Rock Rd
- 26 Timber Rock Rd
- 74 Orchard Dr
- 119 Thurgood St
- 112 Ridgepoint Place
- 12002 Cherry Blossom Place
- 536 Tschiffely Square Rd
- 112 Kent Square Rd
- 408 Ridgepoint Place Unit 38
- 596 Chestertown St
- 11808 Mango Ln
- 15753 Ambiance Dr
- 353 Alfandre Mews
- 15727 Ambiance Dr
- 130 Lake St
- 12006 Citrus Grove Rd
- 17 Quince Mill Ct
- 11817 Quince Mill Dr
- 461 Clayhall St
- 304 Tschiffely Square Rd
- 310 Tschiffely Square Rd
- 115 Little Quarry Rd
- 312 Tschiffely Square Rd
- 314 Tschiffely Square Rd
- 119 Little Quarry Rd
- 123 Little Quarry Rd
- 307 Tschiffely Square Rd
- 318 Tschiffely Square Rd
- 315 Tschiffely Square Rd
- 127 Little Quarry Rd
- 116 Little Quarry Rd
- 322 Tschiffely Square Rd
- 131 Little Quarry Rd
- 321 Tschiffely Square Rd
- 120 Little Quarry Rd
- 311 Tschiffely Square Rd
- 223 Massbury St
- 205 Tschiffely Square Rd
- 112 Little Quarry Rd
Your Personal Tour Guide
Ask me questions while you tour the home.