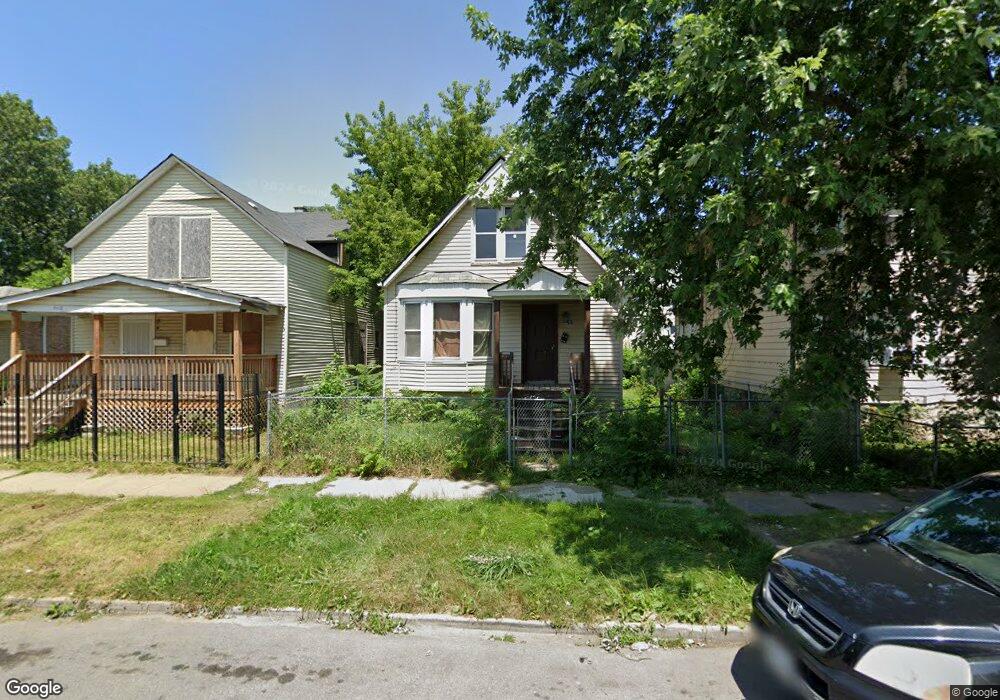
306 W 113th St Chicago, IL 60628
Roseland NeighborhoodEstimated Value: $68,205 - $119,000
3
Beds
1
Bath
704
Sq Ft
$135/Sq Ft
Est. Value
About This Home
This home is located at 306 W 113th St, Chicago, IL 60628 and is currently estimated at $95,301, approximately $135 per square foot. 306 W 113th St is a home located in Cook County with nearby schools including Alex Haley Elementary Academy, Fenger Academy High School, and CICS Prairie.
Ownership History
Date
Name
Owned For
Owner Type
Purchase Details
Closed on
Jan 9, 2009
Sold by
Llc 1
Bought by
Phillips Omarr
Current Estimated Value
Purchase Details
Closed on
Dec 18, 2008
Sold by
Us Bank National Association
Bought by
Llc 1
Purchase Details
Closed on
Oct 29, 2008
Sold by
Bonner Dianon
Bought by
Us Bank National Association
Purchase Details
Closed on
Oct 27, 2005
Sold by
James Juliet M
Bought by
Bonner Dianon
Home Financials for this Owner
Home Financials are based on the most recent Mortgage that was taken out on this home.
Original Mortgage
$72,000
Interest Rate
8.39%
Mortgage Type
Fannie Mae Freddie Mac
Purchase Details
Closed on
Jan 15, 2004
Sold by
Qrt Inc
Bought by
James Juliet
Home Financials for this Owner
Home Financials are based on the most recent Mortgage that was taken out on this home.
Original Mortgage
$67,200
Interest Rate
9.75%
Mortgage Type
Unknown
Purchase Details
Closed on
Jun 16, 2003
Sold by
Cowans George W
Bought by
Qrt Inc
Create a Home Valuation Report for This Property
The Home Valuation Report is an in-depth analysis detailing your home's value as well as a comparison with similar homes in the area
Home Values in the Area
Average Home Value in this Area
Purchase History
| Date | Buyer | Sale Price | Title Company |
|---|---|---|---|
| Phillips Omarr | -- | None Available | |
| Llc 1 | -- | None Available | |
| Us Bank National Association | -- | None Available | |
| Bonner Dianon | $97,000 | Multiple | |
| James Juliet | $84,000 | Chicago Title Insurance Comp | |
| Qrt Inc | $33,000 | Stewart Title |
Source: Public Records
Mortgage History
| Date | Status | Borrower | Loan Amount |
|---|---|---|---|
| Previous Owner | Bonner Dianon | $72,000 | |
| Previous Owner | James Juliet | $67,200 |
Source: Public Records
Tax History
| Year | Tax Paid | Tax Assessment Tax Assessment Total Assessment is a certain percentage of the fair market value that is determined by local assessors to be the total taxable value of land and additions on the property. | Land | Improvement |
|---|---|---|---|---|
| 2025 | $423 | $7,500 | $2,812 | $4,688 |
| 2024 | $423 | $7,500 | $2,812 | $4,688 |
| 2023 | $413 | $2,000 | $1,114 | $886 |
| 2022 | $413 | $2,000 | $1,114 | $886 |
| 2021 | $403 | $2,000 | $1,115 | $885 |
| 2020 | $1,014 | $4,539 | $2,577 | $1,962 |
| 2019 | $1,005 | $4,988 | $2,577 | $2,411 |
| 2018 | $988 | $4,988 | $2,577 | $2,411 |
| 2017 | $1,404 | $6,509 | $2,343 | $4,166 |
| 2016 | $1,307 | $6,509 | $2,343 | $4,166 |
| 2015 | $1,196 | $6,509 | $2,343 | $4,166 |
| 2014 | $1,075 | $5,778 | $2,109 | $3,669 |
| 2013 | $1,053 | $5,778 | $2,109 | $3,669 |
Source: Public Records
Map
Nearby Homes
- 324 W 114th St
- 11354 S Harvard Ave
- 221 W 112th Place
- 11353 S Stewart Ave
- 11236 S Stewart Ave
- 237 W 114th St
- 324 W 112th St
- 245 W 111th Place
- 11341 S Normal Ave
- 252 W 115th St
- 11410 S Eggleston Ave
- 125 W 114th St
- 11322 S Normal Ave
- 147 W 111th Place
- 11413 S Normal Ave
- 101 W 113th Place
- 11130 S Eggleston Ave
- 62 W 113th St
- 306 W 111th St
- 244 W 111th St
- 310 W 113th St
- 300 W 113th St
- 11248 S Princeton Ave
- 312 W 113th St
- 316 W 113th St
- 320 W 113th St
- 311 W 112th Place
- 307 W 112th Place
- 256 W 113th St
- 307 W 113th St Unit 1
- 307 W 113th St
- 309 W 113th St Unit 2
- 309 W 113th St Unit 1
- 309 W 113th St
- 317 W 112th Place
- 303 W 113th St
- 255 W 112th Place
- 319 W 112th Place
- 257 W 113th St
- 325 W 112th Place
Your Personal Tour Guide
Ask me questions while you tour the home.