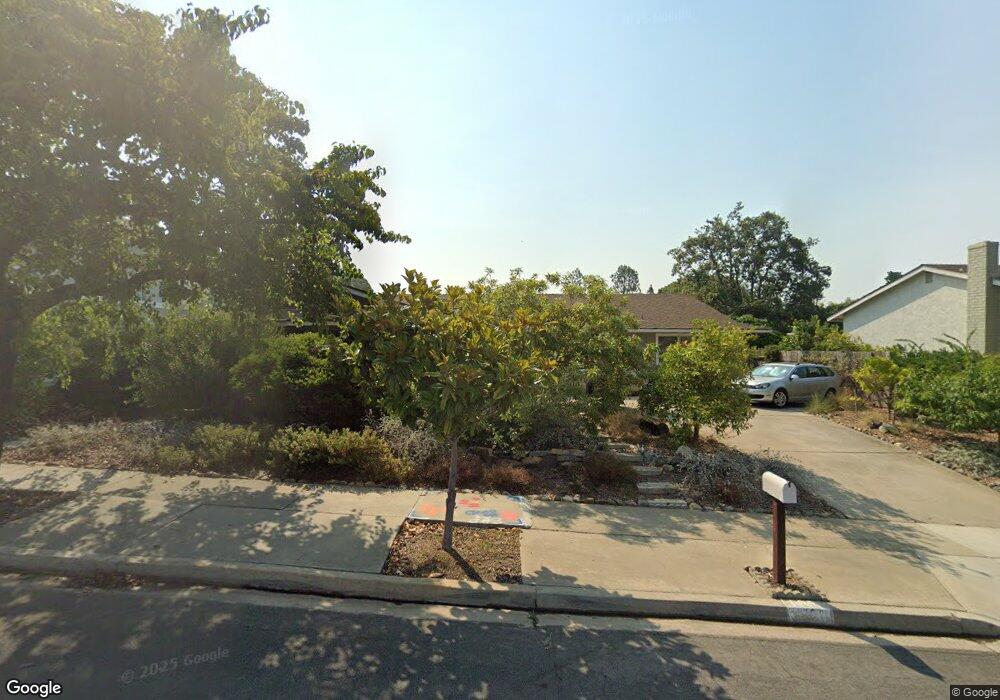
3060 Blenkarne Dr Carlsbad, CA 92008
Olde Carlsbad NeighborhoodEstimated Value: $1,583,356 - $1,841,000
4
Beds
2
Baths
2,007
Sq Ft
$860/Sq Ft
Est. Value
About This Home
This home is located at 3060 Blenkarne Dr, Carlsbad, CA 92008 and is currently estimated at $1,726,339, approximately $860 per square foot. 3060 Blenkarne Dr is a home located in San Diego County with nearby schools including Magnolia Elementary, Carlsbad High School, and Sage Creek High.
Ownership History
Date
Name
Owned For
Owner Type
Purchase Details
Closed on
Mar 16, 2023
Sold by
Hartwell David M and Hartwell Lisa
Bought by
Roop Hartwell Trust
Current Estimated Value
Purchase Details
Closed on
Oct 3, 2007
Sold by
Smarsty Cathleen C
Bought by
Hartwell David M and Roop Lisa
Home Financials for this Owner
Home Financials are based on the most recent Mortgage that was taken out on this home.
Original Mortgage
$417,000
Interest Rate
6.27%
Mortgage Type
Purchase Money Mortgage
Purchase Details
Closed on
Feb 8, 2006
Sold by
Benson Bernard I and Benson Elaine R
Bought by
Smarsty Cathleen C
Create a Home Valuation Report for This Property
The Home Valuation Report is an in-depth analysis detailing your home's value as well as a comparison with similar homes in the area
Home Values in the Area
Average Home Value in this Area
Purchase History
| Date | Buyer | Sale Price | Title Company |
|---|---|---|---|
| Roop Hartwell Trust | -- | -- | |
| Hartwell David M | $597,000 | Chicago Title Co | |
| Smarsty Cathleen C | -- | None Available |
Source: Public Records
Mortgage History
| Date | Status | Borrower | Loan Amount |
|---|---|---|---|
| Previous Owner | Hartwell David M | $417,000 |
Source: Public Records
Tax History Compared to Growth
Tax History
| Year | Tax Paid | Tax Assessment Tax Assessment Total Assessment is a certain percentage of the fair market value that is determined by local assessors to be the total taxable value of land and additions on the property. | Land | Improvement |
|---|---|---|---|---|
| 2025 | $8,196 | $784,151 | $591,072 | $193,079 |
| 2024 | $8,196 | $768,777 | $579,483 | $189,294 |
| 2023 | $8,153 | $738,927 | $556,982 | $181,945 |
| 2022 | $8,026 | $738,927 | $556,982 | $181,945 |
| 2021 | $7,965 | $724,439 | $546,061 | $178,378 |
| 2020 | $7,911 | $717,011 | $540,462 | $176,549 |
| 2019 | $7,767 | $702,953 | $529,865 | $173,088 |
| 2018 | $7,439 | $689,171 | $519,476 | $169,695 |
| 2017 | $7,315 | $675,659 | $509,291 | $166,368 |
| 2016 | $7,021 | $662,411 | $499,305 | $163,106 |
| 2015 | $6,992 | $652,461 | $491,805 | $160,656 |
| 2014 | $6,718 | $625,000 | $470,000 | $155,000 |
Source: Public Records
Map
Nearby Homes
- 2062 Avenue of The Trees
- 2035 Basswood Ave
- 3190 Falcon Dr
- 3306 Donna Dr
- 2225 David Place
- 3354 Seacrest Dr
- 2732 Forest Park Ln
- 3275 Maezel Ln
- 3245 Valley St
- 2334 Kimberly Ct
- 2910 Highland Dr
- 2862 Highland Dr
- 2360 Hosp Way Unit 331
- 3442 Celinda Dr
- 2336 Hosp Way Unit 314
- 1565 Chestnut Ave
- 2517 Via Astuto Unit 1
- 3721 Donna Ct
- 3736 Donna Ct
- 1280 Forest Ave
- 3070 Blenkarne Dr
- 3050 Blenkarne Dr
- 2092 Truesdell Ln
- 2099 Truesdell Ln
- 3040 Blenkarne Dr
- 3080 Blenkarne Dr
- 3055 Blenkarne Dr
- 3045 Blenkarne Dr
- 3065 Blenkarne Dr
- 2082 Truesdell Ln
- 3090 Blenkarne Dr
- 3030 Blenkarne Dr
- 3075 Blenkarne Dr
- 3035 Blenkarne Dr
- 2095 Truesdell Ln
- 3281 Westwood Dr
- 3271 Westwood Dr
- 3285 Westwood Dr
- 3100 Blenkarne Dr
- 3025 Blenkarne Dr