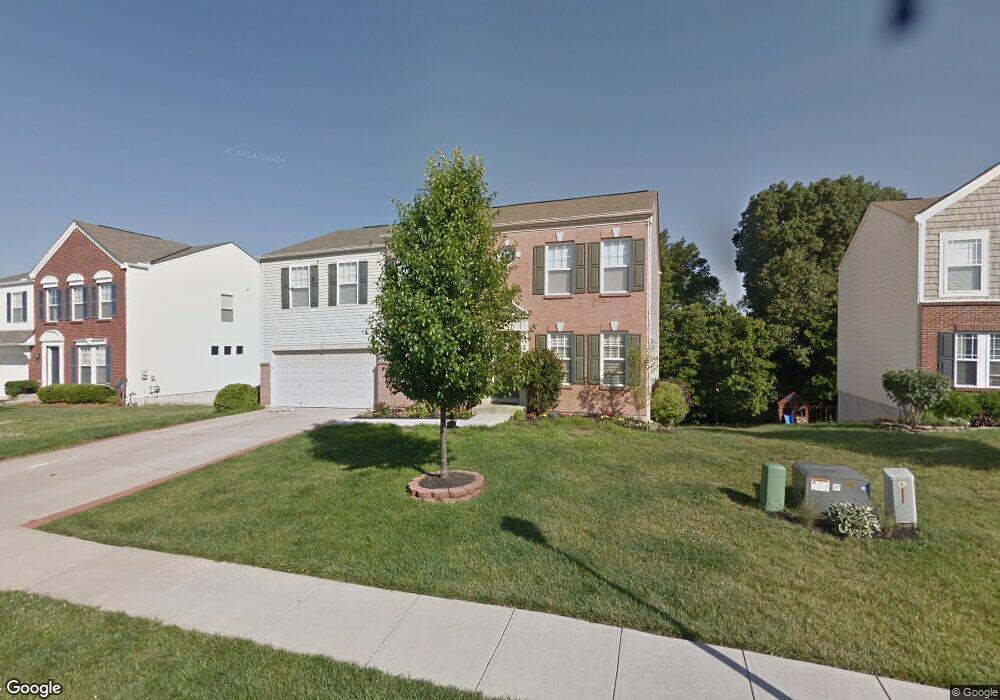
3060 Bruces Trail Unit 217 Independence, KY 41051
Estimated Value: $386,000 - $399,000
4
Beds
3
Baths
2,712
Sq Ft
$144/Sq Ft
Est. Value
About This Home
This home is located at 3060 Bruces Trail Unit 217, Independence, KY 41051 and is currently estimated at $391,230, approximately $144 per square foot. 3060 Bruces Trail Unit 217 is a home located in Kenton County with nearby schools including Taylor Mill Elementary School, Woodland Middle School, and Scott High School.
Ownership History
Date
Name
Owned For
Owner Type
Purchase Details
Closed on
Jul 24, 2020
Sold by
Claybern Eric and Claybern Diane
Bought by
Tackett Melissa R and Tackett Daniel P
Current Estimated Value
Home Financials for this Owner
Home Financials are based on the most recent Mortgage that was taken out on this home.
Original Mortgage
$271,606
Outstanding Balance
$239,766
Interest Rate
3.1%
Mortgage Type
VA
Estimated Equity
$151,464
Purchase Details
Closed on
Jun 21, 2007
Sold by
Maple Street Homes Llc
Bought by
Claybern Eric and Claybern Diane
Home Financials for this Owner
Home Financials are based on the most recent Mortgage that was taken out on this home.
Original Mortgage
$99,342
Interest Rate
6.37%
Mortgage Type
Purchase Money Mortgage
Purchase Details
Closed on
Mar 13, 2007
Sold by
Shadybrook Llc
Bought by
Maple Street Homes Llc
Create a Home Valuation Report for This Property
The Home Valuation Report is an in-depth analysis detailing your home's value as well as a comparison with similar homes in the area
Home Values in the Area
Average Home Value in this Area
Purchase History
| Date | Buyer | Sale Price | Title Company |
|---|---|---|---|
| Tackett Melissa R | $265,500 | American Homeland Title Agcy | |
| Claybern Eric | $198,489 | Homestead Title Agency Ltd | |
| Maple Street Homes Llc | $39,000 | None Available |
Source: Public Records
Mortgage History
| Date | Status | Borrower | Loan Amount |
|---|---|---|---|
| Open | Tackett Melissa R | $271,606 | |
| Previous Owner | Claybern Eric | $99,342 |
Source: Public Records
Tax History
| Year | Tax Paid | Tax Assessment Tax Assessment Total Assessment is a certain percentage of the fair market value that is determined by local assessors to be the total taxable value of land and additions on the property. | Land | Improvement |
|---|---|---|---|---|
| 2025 | $3,483 | $299,500 | $50,000 | $249,500 |
| 2024 | $3,252 | $265,500 | $42,000 | $223,500 |
| 2023 | $3,351 | $265,500 | $42,000 | $223,500 |
| 2022 | $3,405 | $265,500 | $42,000 | $223,500 |
| 2021 | $3,456 | $265,500 | $42,000 | $223,500 |
| 2020 | $2,656 | $198,400 | $42,000 | $156,400 |
| 2019 | $2,663 | $198,400 | $42,000 | $156,400 |
| 2018 | $2,678 | $198,400 | $42,000 | $156,400 |
| 2017 | $2,604 | $198,400 | $42,000 | $156,400 |
| 2015 | $2,531 | $198,400 | $39,000 | $159,400 |
| 2014 | $2,495 | $198,400 | $39,000 | $159,400 |
Source: Public Records
Map
Nearby Homes
- 9738 Cloveridge Dr
- 907 Stablewatch Dr
- 951 Stablewatch Dr
- 968 Stablewatch Dr
- 838 Stablewatch Dr
- 111 Green Hill Dr
- 1479 Hands Pike
- 83 Pitman Ct
- 6376 Stonemill Dr
- 748 Stablewatch Dr
- 798 Stonybrook Ct
- 794 Stonybrook Ct
- 2072 Crown Vetch Dr
- 789 Stonybrook Ct
- 6519 Meadow Creek Dr
- 6500 Meadow Creek Dr
- 718 Willow Green Dr
- 714 Willow Green Dr
- 9137 Tamarack Dr
- 9121 Tamarack Dr
- 3060 Bruces Trail
- 3064 Bruces Trail
- 3064 Bruces Trail Unit 218
- 3056 Bruces Trail
- 3056 Bruces Trail Unit 216
- 3068 Bruces Trail
- 3068 Bruces Trail Unit 219
- 3052 Bruces Trail
- 3061 Bruces Trail
- 3061 Bruces Trail Unit 246
- 2884 Sycamore Creek Dr
- 3072 Bruces Trail
- 3051 Bruces Trail
- 2895 Faubush Ct
- 2895 Faubush Ct Unit 245
- 2880 Sycamore Creek Dr
- 3076 Bruces Trail
- 3045 Bruces Trail Unit 169
- 3045 Bruces Trail
- 2899 Faubush Ct
Your Personal Tour Guide
Ask me questions while you tour the home.