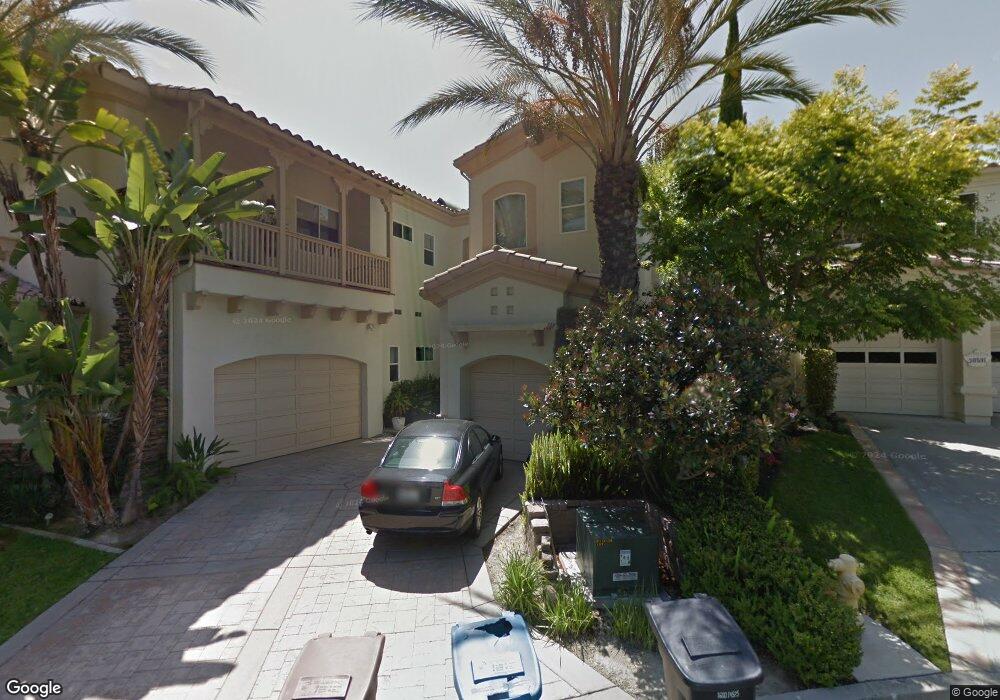
30601 Via Ventana San Juan Capistrano, CA 92675
Estimated Value: $2,987,000 - $3,525,000
5
Beds
5
Baths
4,897
Sq Ft
$679/Sq Ft
Est. Value
About This Home
This home is located at 30601 Via Ventana, San Juan Capistrano, CA 92675 and is currently estimated at $3,327,058, approximately $679 per square foot. 30601 Via Ventana is a home located in Orange County with nearby schools including Harold Ambuehl Elementary School, Marco Forster Middle School, and San Juan Hills High School.
Ownership History
Date
Name
Owned For
Owner Type
Purchase Details
Closed on
Nov 19, 1999
Sold by
Roc Frost and Roc Kathryn
Bought by
Frost Roc and Frost Kathryn L
Current Estimated Value
Home Financials for this Owner
Home Financials are based on the most recent Mortgage that was taken out on this home.
Original Mortgage
$850,000
Outstanding Balance
$271,799
Interest Rate
8.37%
Estimated Equity
$3,055,259
Purchase Details
Closed on
Aug 13, 1996
Sold by
Suzanne Johnson
Bought by
Frost Roc and Frost Kathryn L
Home Financials for this Owner
Home Financials are based on the most recent Mortgage that was taken out on this home.
Original Mortgage
$173,400
Interest Rate
7.87%
Mortgage Type
Seller Take Back
Purchase Details
Closed on
Jul 19, 1993
Sold by
Baumgartner Max
Bought by
Johnson Suzanne R
Create a Home Valuation Report for This Property
The Home Valuation Report is an in-depth analysis detailing your home's value as well as a comparison with similar homes in the area
Home Values in the Area
Average Home Value in this Area
Purchase History
| Date | Buyer | Sale Price | Title Company |
|---|---|---|---|
| Frost Roc | -- | First American Title Ins Co | |
| Frost Roc | $204,000 | First American Title | |
| Johnson Suzanne R | -- | -- |
Source: Public Records
Mortgage History
| Date | Status | Borrower | Loan Amount |
|---|---|---|---|
| Open | Frost Roc | $850,000 | |
| Closed | Frost Roc | $173,400 |
Source: Public Records
Tax History Compared to Growth
Tax History
| Year | Tax Paid | Tax Assessment Tax Assessment Total Assessment is a certain percentage of the fair market value that is determined by local assessors to be the total taxable value of land and additions on the property. | Land | Improvement |
|---|---|---|---|---|
| 2025 | $12,145 | $1,168,269 | $332,258 | $836,011 |
| 2024 | $12,145 | $1,145,362 | $325,743 | $819,619 |
| 2023 | $11,839 | $1,122,904 | $319,355 | $803,549 |
| 2022 | $11,355 | $1,100,887 | $313,093 | $787,794 |
| 2021 | $11,146 | $1,079,301 | $306,953 | $772,348 |
| 2020 | $11,047 | $1,068,235 | $303,806 | $764,429 |
| 2019 | $10,843 | $1,047,290 | $297,849 | $749,441 |
| 2018 | $10,649 | $1,026,755 | $292,008 | $734,747 |
| 2017 | $10,552 | $1,006,623 | $286,282 | $720,341 |
| 2016 | $10,358 | $986,886 | $280,669 | $706,217 |
| 2015 | $10,200 | $972,063 | $276,454 | $695,609 |
| 2014 | $10,021 | $953,022 | $271,039 | $681,983 |
Source: Public Records
Map
Nearby Homes
- 30671 Marbella Vista
- 90 Plaza de Las Flores
- 30532 Marbella Vista
- 70 Plaza Cuesta
- 30981 Via Mirador
- 30372 Marbella Vista
- 27281 Viewpoint Cir
- 30828 Calle Chueca
- 30431 Via Festivo
- 27591 Rolling Wood Ln
- 31121 Via Santo Tomas
- 31024 Calle San Diego Unit 94b
- 27381 Via Priorato
- 26447 Paseo Carmel Unit 11D
- 31261 Paseo Olivos
- 26468 Calle San Antonio
- 27703 Ortega Hwy Unit 13
- 27703 Ortega Hwy Unit 127
- 31278 Calle San Juan Unit 12
- 31284 Calle San Juan Unit 14
- 30591 Via Ventana
- 30621 Via Ventana
- 30581 Via Ventana
- 30451 Via Ventana
- 30461 Via Ventana
- 30571 Via Ventana
- 30441 Via Ventana
- 30661 Marbella Vista
- 30651 Marbella Vista
- 30561 Via Ventana
- 30471 Via Ventana
- 30541 Via Ventana
- 30681 Marbella Vista
- 30481 Via Ventana
- 30501 Via Ventana
- 30531 Via Ventana
- 30511 Via Ventana
- 30652 Marbella Vista
- 30642 Marbella Vista
- 30491 Via Ventana