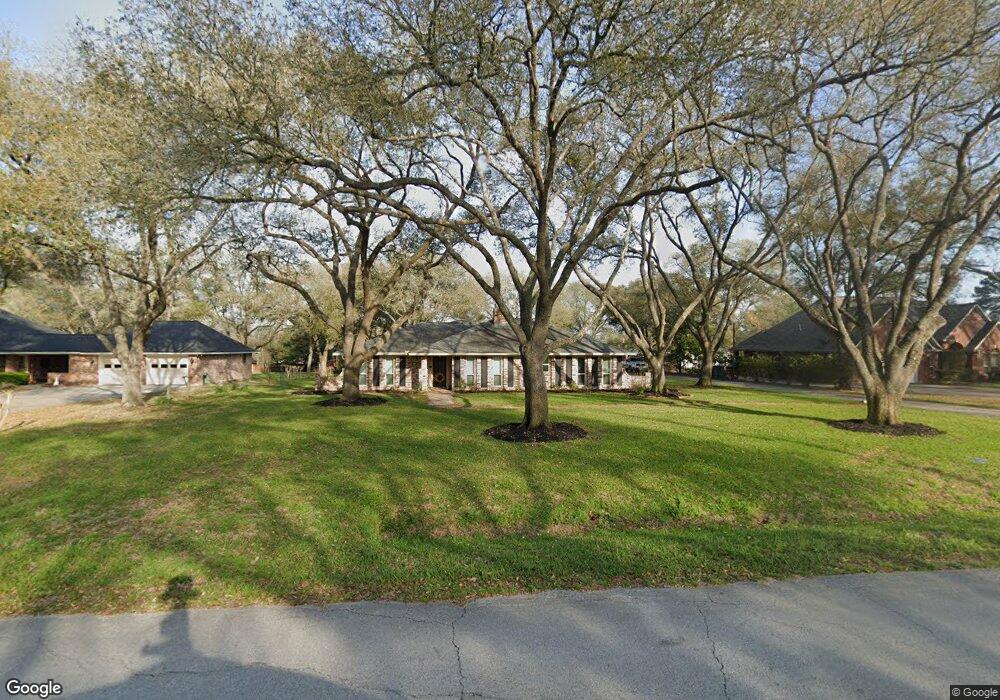
30618 Quinn Rd Tomball, TX 77375
Estimated Value: $442,000 - $510,996
3
Beds
2
Baths
2,387
Sq Ft
$199/Sq Ft
Est. Value
About This Home
This home is located at 30618 Quinn Rd, Tomball, TX 77375 and is currently estimated at $474,999, approximately $198 per square foot. 30618 Quinn Rd is a home located in Harris County with nearby schools including Tomball Elementary School, Tomball Intermediate School, and Tomball Junior High School.
Ownership History
Date
Name
Owned For
Owner Type
Purchase Details
Closed on
Apr 13, 2017
Sold by
Murrell Susan
Bought by
Wilkie Drew and Melton Kelly
Current Estimated Value
Home Financials for this Owner
Home Financials are based on the most recent Mortgage that was taken out on this home.
Original Mortgage
$301,750
Outstanding Balance
$250,342
Interest Rate
4.1%
Mortgage Type
New Conventional
Estimated Equity
$224,657
Purchase Details
Closed on
Aug 12, 2016
Sold by
Mccarty Lane A
Bought by
Murrell Susan
Purchase Details
Closed on
Jun 9, 2006
Sold by
Prophet Peggy Jean Simpson and Simpson Dean Ellis
Bought by
Mccarty Lane A
Home Financials for this Owner
Home Financials are based on the most recent Mortgage that was taken out on this home.
Original Mortgage
$31,800
Interest Rate
6.56%
Mortgage Type
Stand Alone Second
Create a Home Valuation Report for This Property
The Home Valuation Report is an in-depth analysis detailing your home's value as well as a comparison with similar homes in the area
Home Values in the Area
Average Home Value in this Area
Purchase History
| Date | Buyer | Sale Price | Title Company |
|---|---|---|---|
| Wilkie Drew | -- | None Available | |
| Murrell Susan | -- | Alamo Title Co | |
| Mccarty Lane A | -- | Stewart Title Houston Div |
Source: Public Records
Mortgage History
| Date | Status | Borrower | Loan Amount |
|---|---|---|---|
| Open | Wilkie Drew | $301,750 | |
| Previous Owner | Mccarty Lane A | $31,800 | |
| Previous Owner | Mccarty Lane A | $169,600 |
Source: Public Records
Tax History Compared to Growth
Tax History
| Year | Tax Paid | Tax Assessment Tax Assessment Total Assessment is a certain percentage of the fair market value that is determined by local assessors to be the total taxable value of land and additions on the property. | Land | Improvement |
|---|---|---|---|---|
| 2025 | $6,280 | $455,051 | $172,278 | $282,773 |
| 2024 | $6,280 | $464,803 | $172,278 | $292,525 |
| 2023 | $6,280 | $464,803 | $172,278 | $292,525 |
| 2022 | $6,567 | $385,000 | $107,674 | $277,326 |
| 2021 | $6,282 | $270,000 | $66,758 | $203,242 |
| 2020 | $5,905 | $240,776 | $66,758 | $174,018 |
| 2019 | $6,070 | $240,776 | $66,758 | $174,018 |
| 2018 | $2,596 | $218,745 | $66,758 | $151,987 |
| 2017 | $5,512 | $218,745 | $66,758 | $151,987 |
| 2016 | $5,490 | $218,745 | $66,758 | $151,987 |
| 2015 | $4,145 | $218,745 | $66,758 | $151,987 |
| 2014 | $4,145 | $212,600 | $60,297 | $152,303 |
Source: Public Records
Map
Nearby Homes
- 14134 Pollux Ct
- 14123 Spring Pines Dr
- 14210 Altair Dr
- 13303 Lost Creek Rd
- 31318 Bearing Star Ln
- 31410 Bearing Star Ln
- 31335 Bearing Star Ln
- 31407 Bearing Star Ln
- 14222 Spring Pines Dr
- 1302 Pine Trail
- 11211 Stirton Dr
- 11235 Stirton Dr
- 1319 Pine Trail
- 930 Arbor Pine
- 1310 Big Pines
- 1315 Big Pines
- 1314 Pine Brook
- 31414 Helen Ln
- 14219 Turnervine Dr
- 28102 Linda Ln
- 30626 Quinn Rd
- 30616 Quinn Rd
- 30614 Quinn Rd
- 13631 Country Hill Ct
- 30621 Quinn Rd
- 30630 Quinn Rd
- 13626 Country Hill Ct
- 30617 Quinn Rd
- 13627 Country Hill Ct
- 13627 Country Pine Ct
- 30714 Quinn Rd
- 13631 Country Pine Ct
- 30610 Quinn Rd
- 13622 Country Ln
- 13622 Country Hill Ct
- 13623 Country Hill Ct
- 13635 Country Pine Ct
- 13623 Country Pine Ct
- 30607 Quinn Rd
- 13639 Country Pine Ct