Estimated Value: $713,984 - $795,000
5
Beds
3
Baths
3,629
Sq Ft
$209/Sq Ft
Est. Value
About This Home
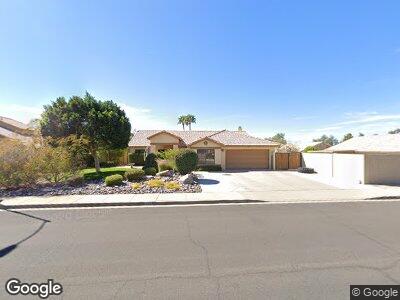
This home is located at 3062 N Sericin, Mesa, AZ 85215 and is currently estimated at $759,746, approximately $209 per square foot. 3062 N Sericin is a home located in Maricopa County with nearby schools including Red Mountain Ranch Elementary School, Franklin at Brimhall Elementary School, and Franklin West Elementary School.
Ownership History
Date
Name
Owned For
Owner Type
Purchase Details
Closed on
May 2, 2007
Sold by
Ewing David E
Bought by
Ewing David E and The Ewing Family Trust
Current Estimated Value
Home Financials for this Owner
Home Financials are based on the most recent Mortgage that was taken out on this home.
Original Mortgage
$392,000
Outstanding Balance
$258,165
Interest Rate
7.37%
Mortgage Type
New Conventional
Estimated Equity
$501,581
Purchase Details
Closed on
Oct 1, 2005
Sold by
Ewing David
Bought by
Ewing David E and Ewing Family Trust
Purchase Details
Closed on
Jul 29, 2005
Sold by
Wallace Delva
Bought by
Ewing David
Home Financials for this Owner
Home Financials are based on the most recent Mortgage that was taken out on this home.
Original Mortgage
$359,920
Interest Rate
1%
Mortgage Type
New Conventional
Purchase Details
Closed on
Sep 14, 1994
Sold by
Wallace Donald C and Wallace Delva
Bought by
Wallace Donald C and Wallace Delva
Create a Home Valuation Report for This Property
The Home Valuation Report is an in-depth analysis detailing your home's value as well as a comparison with similar homes in the area
Home Values in the Area
Average Home Value in this Area
Purchase History
| Date | Buyer | Sale Price | Title Company |
|---|---|---|---|
| Ewing David E | -- | None Available | |
| Ewing David E | -- | Transnation Title Ins Co | |
| Ewing David E | -- | -- | |
| Ewing David | $449,900 | -- | |
| Wallace Donald C | -- | -- |
Source: Public Records
Mortgage History
| Date | Status | Borrower | Loan Amount |
|---|---|---|---|
| Open | Ewing David E | $392,000 | |
| Closed | Ewing David | $359,920 | |
| Closed | Ewing David | $44,990 |
Source: Public Records
Tax History Compared to Growth
Tax History
| Year | Tax Paid | Tax Assessment Tax Assessment Total Assessment is a certain percentage of the fair market value that is determined by local assessors to be the total taxable value of land and additions on the property. | Land | Improvement |
|---|---|---|---|---|
| 2025 | $2,507 | $30,215 | -- | -- |
| 2024 | $2,537 | $28,776 | -- | -- |
| 2023 | $2,537 | $46,920 | $9,380 | $37,540 |
| 2022 | $2,481 | $35,900 | $7,180 | $28,720 |
| 2021 | $2,549 | $34,210 | $6,840 | $27,370 |
| 2020 | $2,515 | $32,980 | $6,590 | $26,390 |
| 2019 | $2,330 | $30,200 | $6,040 | $24,160 |
| 2018 | $2,224 | $27,470 | $5,490 | $21,980 |
| 2017 | $2,155 | $25,700 | $5,140 | $20,560 |
| 2016 | $2,116 | $25,300 | $5,060 | $20,240 |
| 2015 | $1,997 | $23,950 | $4,790 | $19,160 |
Source: Public Records
Map
Nearby Homes
- 6544 E Portia St Unit IV
- 3034 N Ricardo
- 6456 E Orion St
- 2851 N Ricardo
- 6514 E Oasis St
- 6631 E Rhodes St
- 3321 N Silverado
- 6452 E Omega St
- 3365 N Sunaire
- 2923 N 63rd St
- 6310 E Portia St Unit 3C
- 6912 E Quill St
- 3061 N Platina Cir Unit N
- 6929 E Quill St
- 2726 N Ricardo
- 6713 E Riverdale St
- 6948 E Quill St
- 6617 E Northridge St
- 6264 E Omega St
- 6844 E Pearl St
- 3062 N Sericin
- 3054 N Sericin
- 6645 E Preston St
- 3063 N Saffron Unit IV
- 6637 E Preston St
- 6620 E Portia St
- 3046 N Sericin
- 6629 E Preston St
- 3047 N Saffron Unit IV
- 3038 N Sericin
- 6623 E Preston St
- 6642 E Preston St
- 3035 N Saffron
- 3056 N Saffron
- 3030 N Sericin
- 6606 E Portia St
- 6626 E Preston St
- 6615 E Preston St
- 3023 N Saffron
- 3040 N Saffron