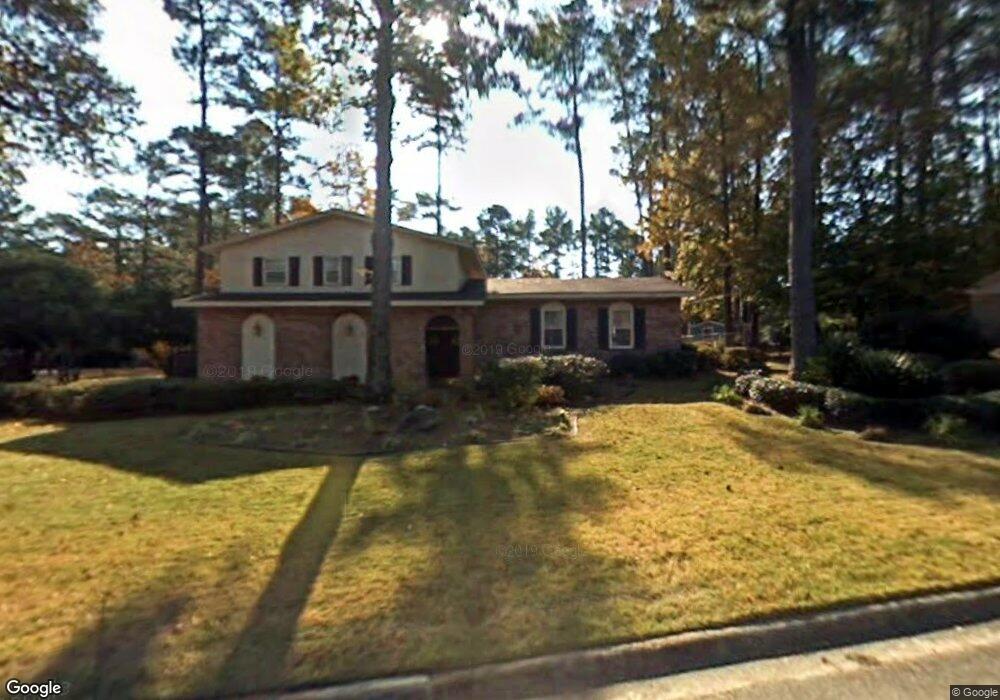
3062 Westwood Rd Augusta, GA 30909
West Augusta NeighborhoodEstimated Value: $338,710 - $368,000
4
Beds
3
Baths
2,454
Sq Ft
$143/Sq Ft
Est. Value
About This Home
This home is located at 3062 Westwood Rd, Augusta, GA 30909 and is currently estimated at $351,678, approximately $143 per square foot. 3062 Westwood Rd is a home located in Richmond County with nearby schools including First Coast Technical Institute, R.B. Hunt Elementary School, and A. Brian Merry Elementary School.
Ownership History
Date
Name
Owned For
Owner Type
Purchase Details
Closed on
Oct 25, 2001
Sold by
Mompoint Claude and Mompoint Marie Flore
Bought by
Mompoint Claude and Mompoint Marie Flore
Current Estimated Value
Home Financials for this Owner
Home Financials are based on the most recent Mortgage that was taken out on this home.
Original Mortgage
$104,000
Outstanding Balance
$40,263
Interest Rate
6.74%
Estimated Equity
$311,415
Purchase Details
Closed on
Sep 30, 1999
Sold by
Hale Emory L and Hale Vola J
Bought by
Mompoint Claude and Mompoint Marie Flore
Home Financials for this Owner
Home Financials are based on the most recent Mortgage that was taken out on this home.
Original Mortgage
$101,100
Interest Rate
7.85%
Purchase Details
Closed on
Feb 4, 1994
Sold by
Hart Robert T
Bought by
Hale Emory L
Purchase Details
Closed on
Aug 1, 1986
Sold by
Miles Bernard L
Bought by
Hart Robert T
Create a Home Valuation Report for This Property
The Home Valuation Report is an in-depth analysis detailing your home's value as well as a comparison with similar homes in the area
Home Values in the Area
Average Home Value in this Area
Purchase History
| Date | Buyer | Sale Price | Title Company |
|---|---|---|---|
| Mompoint Claude | -- | -- | |
| Mompoint Claude | $128,900 | -- | |
| Hale Emory L | $117,500 | -- | |
| Hart Robert T | $91,500 | -- |
Source: Public Records
Mortgage History
| Date | Status | Borrower | Loan Amount |
|---|---|---|---|
| Open | Mompoint Claude | $104,000 | |
| Closed | Mompoint Claude | $101,100 |
Source: Public Records
Tax History Compared to Growth
Tax History
| Year | Tax Paid | Tax Assessment Tax Assessment Total Assessment is a certain percentage of the fair market value that is determined by local assessors to be the total taxable value of land and additions on the property. | Land | Improvement |
|---|---|---|---|---|
| 2025 | $517 | $123,568 | $14,800 | $108,768 |
| 2024 | $517 | $121,932 | $14,800 | $107,132 |
| 2023 | $406 | $117,036 | $14,800 | $102,236 |
| 2022 | $433 | $103,090 | $14,800 | $88,290 |
| 2021 | $396 | $81,991 | $14,800 | $67,191 |
| 2020 | $396 | $81,991 | $14,800 | $67,191 |
| 2019 | $2,552 | $71,641 | $14,000 | $57,641 |
| 2018 | $2,570 | $71,641 | $14,000 | $57,641 |
| 2017 | $2,535 | $71,641 | $14,000 | $57,641 |
| 2016 | $2,537 | $71,641 | $14,000 | $57,641 |
| 2015 | $2,555 | $71,641 | $14,000 | $57,641 |
| 2014 | $2,558 | $71,641 | $14,000 | $57,641 |
Source: Public Records
Map
Nearby Homes
- 3084 Westwood Rd
- 3082 Westwood Rd
- 3086 Westwood Rd
- 2703 Oakbluff Ct
- 26 Mulberry Ln
- 2507 Pinebluff Ct
- 2413 Woodbluff Ct
- 3129 Ramsgate Rd
- 3121 Ramsgate Rd
- 3144 Edinburgh Dr
- 3129 Edinburgh Dr
- 3103 Clay Hill Dr
- 2695 York Dr
- 46 Charlestowne Dr
- 2914 Westchester Dr
- 2920 Sussex Rd
- 3122 Sussex Rd
- 2918 Arrowhead Dr
- 629 Canterbury Dr
- 3218 Ramsgate Rd
- 3060 Westwood Rd
- 414 Dorchester Dr
- 3080 Westwood Rd
- 3058 Westwood Ct
- 3065 Westwood Rd
- 416 Dorchester Dr
- 3063 Westwood Rd
- 3056 Westwood Ct
- 3061 Westwood Rd
- 3050 Westwood Rd
- 418 Dorchester Dr
- 3059 Westwood Rd
- 410 Dorchester Dr
- 413 Dorchester Dr
- 411 Dorchester Dr
- 415 Dorchester Dr
- 3057 Westwood Rd
- 3052 Westwood Ct
- 3048 Westwood Rd
- 422 Dorchester Dr