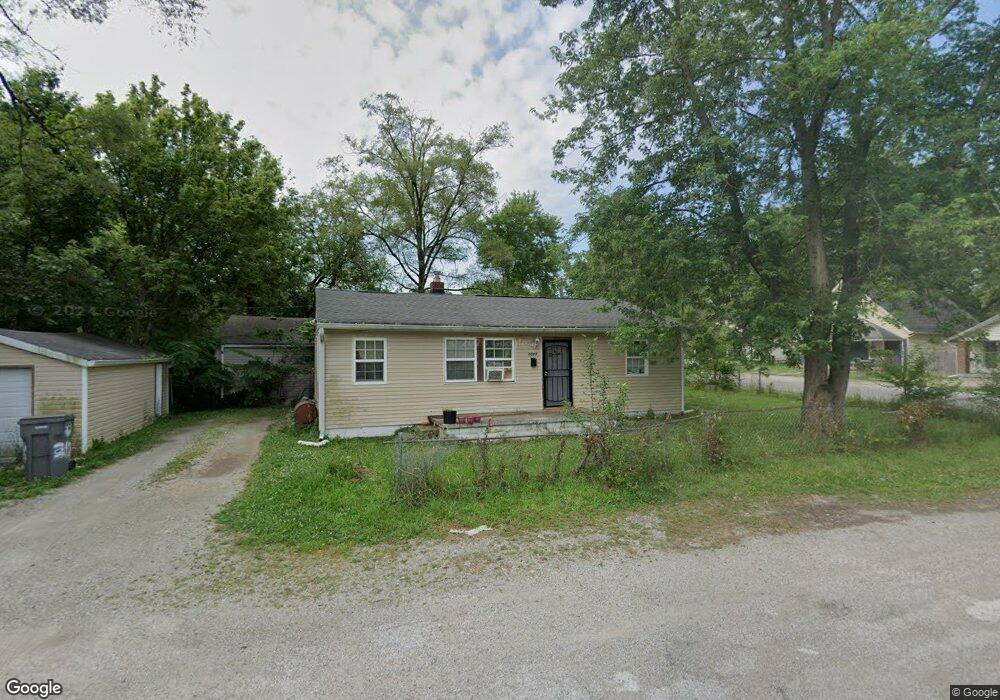
3063 N Gladstone Ave Indianapolis, IN 46218
Martindale-Brightwood NeighborhoodEstimated Value: $102,000 - $133,000
3
Beds
1
Bath
912
Sq Ft
$128/Sq Ft
Est. Value
About This Home
This home is located at 3063 N Gladstone Ave, Indianapolis, IN 46218 and is currently estimated at $116,685, approximately $127 per square foot. 3063 N Gladstone Ave is a home located in Marion County with nearby schools including James Russell Lowell School 51, Thomas D. Gregg School No. 15, and Washington Irving School 14.
Ownership History
Date
Name
Owned For
Owner Type
Purchase Details
Closed on
May 16, 2017
Sold by
Jefferson Torrien
Bought by
Cunningham Durell L
Current Estimated Value
Purchase Details
Closed on
Feb 6, 2017
Sold by
Scott Jeffrey
Bought by
Jefferson Torrien
Purchase Details
Closed on
Sep 30, 2016
Sold by
Scott Jeffrey
Bought by
Scott Rakiesha
Purchase Details
Closed on
Jul 11, 2014
Sold by
Marion County
Bought by
Middlebrook Eric
Purchase Details
Closed on
Jul 10, 2014
Sold by
Bottom Line Matters Inc
Bought by
County Of Marion
Purchase Details
Closed on
Feb 8, 2010
Sold by
Guiden Michael
Bought by
Bottom Line Matters Inc
Purchase Details
Closed on
Jun 12, 2006
Sold by
Fv 1 Inc
Bought by
Guiden Michael
Purchase Details
Closed on
Mar 28, 2006
Sold by
Terrell Brenda J and Johnson Jimmy C
Bought by
Fv 1 Inc
Create a Home Valuation Report for This Property
The Home Valuation Report is an in-depth analysis detailing your home's value as well as a comparison with similar homes in the area
Home Values in the Area
Average Home Value in this Area
Purchase History
| Date | Buyer | Sale Price | Title Company |
|---|---|---|---|
| Cunningham Durell L | -- | -- | |
| Jefferson Torrien | -- | -- | |
| Scott Rakiesha | -- | None Available | |
| Middlebrook Eric | $3,500 | -- | |
| Middlebrook Eric | $3,500 | None Available | |
| County Of Marion | $1,958 | None Available | |
| Bottom Line Matters Inc | -- | Carpenter Title Agency Inc | |
| Guiden Michael | $17,000 | None Available | |
| Fv 1 Inc | $30,750 | None Available |
Source: Public Records
Tax History Compared to Growth
Tax History
| Year | Tax Paid | Tax Assessment Tax Assessment Total Assessment is a certain percentage of the fair market value that is determined by local assessors to be the total taxable value of land and additions on the property. | Land | Improvement |
|---|---|---|---|---|
| 2024 | $1,502 | $60,400 | $4,900 | $55,500 |
| 2023 | $1,502 | $60,400 | $4,900 | $55,500 |
| 2022 | $1,433 | $57,800 | $4,900 | $52,900 |
| 2021 | $867 | $34,700 | $4,900 | $29,800 |
| 2020 | $818 | $32,500 | $2,200 | $30,300 |
| 2019 | $796 | $31,000 | $2,200 | $28,800 |
| 2018 | $695 | $26,500 | $2,200 | $24,300 |
| 2017 | $578 | $24,300 | $2,200 | $22,100 |
| 2016 | $526 | $22,400 | $2,200 | $20,200 |
| 2014 | $619 | $21,900 | $2,200 | $19,700 |
| 2013 | $619 | $29,900 | $2,200 | $27,700 |
Source: Public Records
Map
Nearby Homes
- 2750 Forest Manor Ave
- 3126 Forest Manor Ave
- 3142 N Euclid Ave
- 4019 E 31st St
- 4311 E 30th St
- 2933 N Gladstone Ave
- 3918 E 30th St
- 2907 Forest Manor Ave
- 3239 N Colorado Ave
- 3161 N Colorado Ave
- 3147 N Colorado Ave
- 3306 N Drexel Ave
- 3829 E 31st St
- 2866 Forest Manor Ave
- 2919 N Denny St
- 2946 N Denny St
- 3315 N Euclid Ave
- 2823 N Gladstone Ave
- 3334 N Chester Ave
- 2949 Wallace Ave
- 3059 N Gladstone Ave
- 3101 N Gladstone Ave
- 3055 N Gladstone Ave
- 3103 N Gladstone Ave
- 3045 N Gladstone Ave
- 3052 N Colorado Ave
- 3102 N Colorado Ave
- 3062 N Gladstone Ave
- 3058 N Gladstone Ave
- 3048 N Colorado Ave
- 3035 N Gladstone Ave
- 3104 N Colorado Ave
- 3056 N Gladstone Ave
- 3102 N Gladstone Ave
- 3025 N Gladstone Ave
- 3046 N Gladstone Ave
- 3117 N Gladstone Ave
- 3040 N Colorado Ave
- 3108 N Colorado Ave
- 3042 N Gladstone Ave