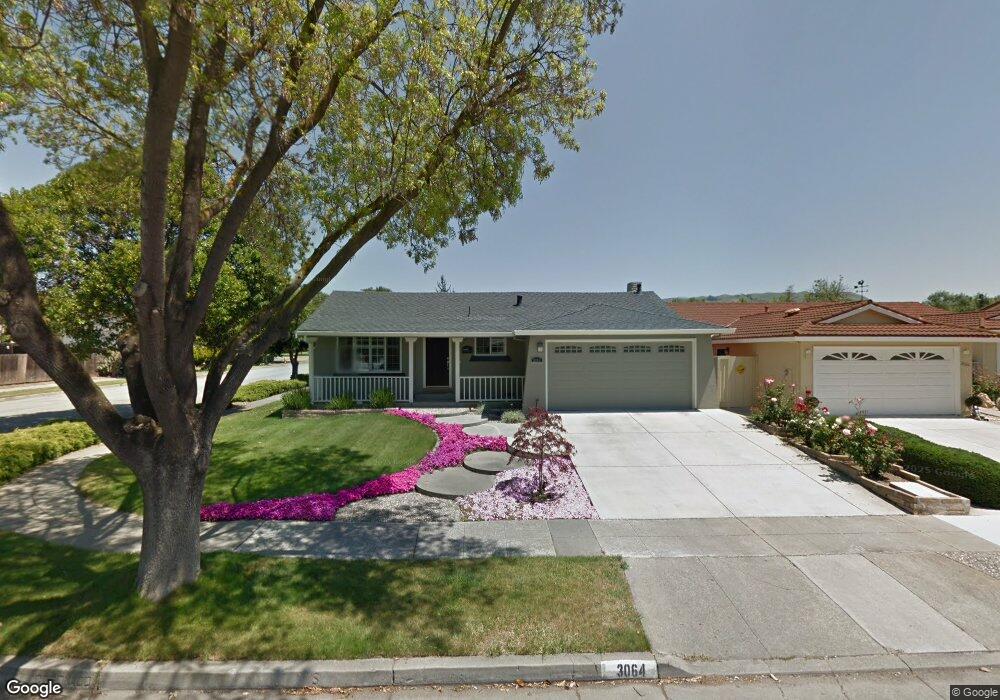
3064 Via Del Coronado San Jose, CA 95132
Capewood NeighborhoodEstimated Value: $1,500,992 - $1,636,000
3
Beds
2
Baths
1,372
Sq Ft
$1,140/Sq Ft
Est. Value
About This Home
This home is located at 3064 Via Del Coronado, San Jose, CA 95132 and is currently estimated at $1,564,498, approximately $1,140 per square foot. 3064 Via Del Coronado is a home located in Santa Clara County with nearby schools including Laneview Elementary School, Morrill Middle School, and Independence High School.
Ownership History
Date
Name
Owned For
Owner Type
Purchase Details
Closed on
Jul 31, 2017
Sold by
Mendez Stella C
Bought by
Mendez Stella C
Current Estimated Value
Purchase Details
Closed on
Nov 26, 2002
Sold by
Mendez Steve A and Mendez Stella C
Bought by
Mendez Stella C
Home Financials for this Owner
Home Financials are based on the most recent Mortgage that was taken out on this home.
Original Mortgage
$300,000
Interest Rate
5.12%
Purchase Details
Closed on
Dec 2, 1998
Sold by
Mendez Steve A and Mendez Stella C
Bought by
Mendez Steve A and Mendez Stella C
Home Financials for this Owner
Home Financials are based on the most recent Mortgage that was taken out on this home.
Original Mortgage
$109,500
Interest Rate
6.78%
Create a Home Valuation Report for This Property
The Home Valuation Report is an in-depth analysis detailing your home's value as well as a comparison with similar homes in the area
Home Values in the Area
Average Home Value in this Area
Purchase History
| Date | Buyer | Sale Price | Title Company |
|---|---|---|---|
| Mendez Stella C | -- | None Available | |
| Mendez Stella C | -- | New Century Title Company | |
| Mendez Steve A | -- | North American Title Co |
Source: Public Records
Mortgage History
| Date | Status | Borrower | Loan Amount |
|---|---|---|---|
| Closed | Mendez Stella C | $300,000 | |
| Closed | Mendez Steve A | $109,500 |
Source: Public Records
Tax History Compared to Growth
Tax History
| Year | Tax Paid | Tax Assessment Tax Assessment Total Assessment is a certain percentage of the fair market value that is determined by local assessors to be the total taxable value of land and additions on the property. | Land | Improvement |
|---|---|---|---|---|
| 2025 | $3,539 | $164,728 | $51,387 | $113,341 |
| 2024 | $3,539 | $161,499 | $50,380 | $111,119 |
| 2023 | $3,436 | $158,334 | $49,393 | $108,941 |
| 2022 | $3,409 | $155,230 | $48,425 | $106,805 |
| 2021 | $3,261 | $152,187 | $47,476 | $104,711 |
| 2020 | $3,128 | $150,628 | $46,990 | $103,638 |
| 2019 | $3,002 | $147,675 | $46,069 | $101,606 |
| 2018 | $2,943 | $144,780 | $45,166 | $99,614 |
| 2017 | $2,932 | $141,942 | $44,281 | $97,661 |
| 2016 | $2,804 | $139,160 | $43,413 | $95,747 |
| 2015 | $2,761 | $137,070 | $42,761 | $94,309 |
| 2014 | $2,286 | $134,386 | $41,924 | $92,462 |
Source: Public Records
Map
Nearby Homes
- 1982 Plaza Montez
- 3108 Kermath Dr
- 3139 Laneview Dr
- 2844 Parkrow Ln
- 2085 Ashwood Ln
- 3093 Melchester Dr
- 3248 Woody Ln
- 3070 Ironside Ct
- 3252 Cropley Ave
- 1756 Valhalla Ct
- 1710 Clear Lake Ave
- 3211 Parkhaven Dr
- 2075 Lakewood Dr
- 2625 Autumnvale Dr
- 1612 Tahoe Dr
- 2158 Capitol Park Ct
- 1536 Sonoma Dr
- 1693 Peachwood Dr
- 2200 Beech Cir
- 3352 Landess Ave Unit D
- 3060 Via Del Coronado
- 1997 Morrill Ave
- 3056 Via Del Coronado
- 1985 Morrill Ave
- 3075 Via Del Sol
- 1973 Morrill Ave
- 3063 Via Del Coronado
- 2007 Morrill Ave
- 3059 Via Del Coronado
- 3052 Via Del Coronado
- 3071 Via Del Sol
- 3072 Via Del Sol
- 1961 Morrill Ave
- 3055 Via Del Coronado
- 2015 Morrill Ave
- 3048 Via Del Coronado
- 3067 Via Del Sol
- 3051 Via Del Coronado
- 3041 Via Montez
- 1949 Morrill Ave