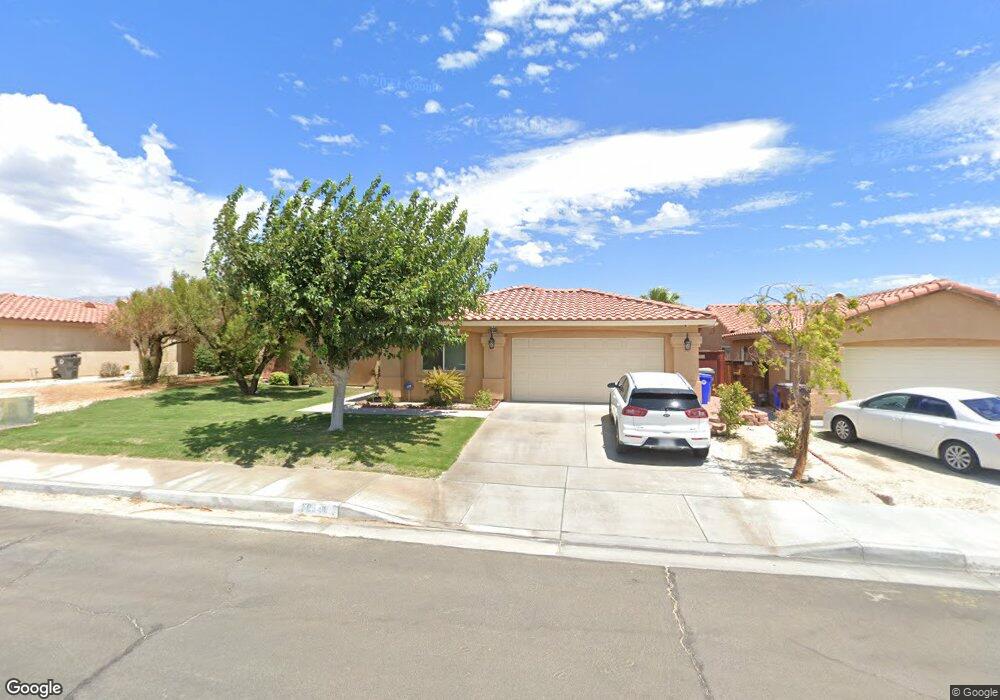
30648 Via Pared Thousand Palms, CA 92276
Estimated Value: $457,000 - $546,436
4
Beds
2
Baths
1,984
Sq Ft
$251/Sq Ft
Est. Value
About This Home
This home is located at 30648 Via Pared, Thousand Palms, CA 92276 and is currently estimated at $497,359, approximately $250 per square foot. 30648 Via Pared is a home located in Riverside County with nearby schools including Della S. Lindley Elementary School, Nellie N. Coffman Middle School, and Rancho Mirage High.
Ownership History
Date
Name
Owned For
Owner Type
Purchase Details
Closed on
Sep 20, 2021
Sold by
Richardson John and Richardson Sydelle
Bought by
Richardson John V and Richardson Sydelle L
Current Estimated Value
Purchase Details
Closed on
Aug 15, 2014
Sold by
Richardson John
Bought by
Richardson John and Richardson Sydelle
Purchase Details
Closed on
Jun 29, 2011
Sold by
Perry Norman D and Perry Elizabeth A
Bought by
Richardson John
Home Financials for this Owner
Home Financials are based on the most recent Mortgage that was taken out on this home.
Original Mortgage
$157,893
Interest Rate
3.75%
Mortgage Type
FHA
Purchase Details
Closed on
Dec 4, 2003
Sold by
Desert Community Developers Llc
Bought by
Perry Norman D and Perry Elizabeth A
Home Financials for this Owner
Home Financials are based on the most recent Mortgage that was taken out on this home.
Original Mortgage
$193,533
Interest Rate
5.65%
Mortgage Type
Purchase Money Mortgage
Create a Home Valuation Report for This Property
The Home Valuation Report is an in-depth analysis detailing your home's value as well as a comparison with similar homes in the area
Home Values in the Area
Average Home Value in this Area
Purchase History
| Date | Buyer | Sale Price | Title Company |
|---|---|---|---|
| Richardson John V | -- | None Available | |
| Richardson John | -- | None Available | |
| Richardson John | $162,000 | Orange Coast Title Co | |
| Perry Norman D | $242,918 | First American Title Co |
Source: Public Records
Mortgage History
| Date | Status | Borrower | Loan Amount |
|---|---|---|---|
| Previous Owner | Richardson John | $157,893 | |
| Previous Owner | Perry Norman D | $193,533 | |
| Closed | Perry Norman D | $36,287 |
Source: Public Records
Tax History
| Year | Tax Paid | Tax Assessment Tax Assessment Total Assessment is a certain percentage of the fair market value that is determined by local assessors to be the total taxable value of land and additions on the property. | Land | Improvement |
|---|---|---|---|---|
| 2025 | $2,966 | $203,465 | $40,687 | $162,778 |
| 2023 | $2,966 | $195,566 | $39,108 | $156,458 |
| 2022 | $2,803 | $191,733 | $38,342 | $153,391 |
| 2021 | $2,724 | $187,975 | $37,591 | $150,384 |
| 2020 | $2,595 | $186,048 | $37,206 | $148,842 |
| 2019 | $2,552 | $182,401 | $36,477 | $145,924 |
| 2018 | $2,506 | $178,825 | $35,763 | $143,062 |
| 2017 | $2,486 | $175,319 | $35,062 | $140,257 |
| 2016 | $2,437 | $171,882 | $34,375 | $137,507 |
| 2015 | $2,356 | $169,302 | $33,859 | $135,443 |
| 2014 | $2,338 | $165,988 | $33,197 | $132,791 |
Source: Public Records
Map
Nearby Homes
- 30865 Via Pared
- 30724 Roseview Ln
- 30621 Arbol Real
- 31131 Calle Jessica
- 31474 Via Ventana
- 72998 30th Ave
- 72865 La Canada Way
- 32 Calle Helene
- 31652 Arbol Real
- 72300 E Ramon Rd
- 0 Desert Park Dr Unit 219144639DA
- 2-15 30th Ave
- 32059 Westchester Dr
- 32075 Westchester Dr
- 01 Ramon Rd
- 03 Ramon Rd
- 02 Ramon Rd
- 32060 Oakland Hills
- 32150 Cody Ave
- 32222 Cody Ave
- 30622 Vía Pared
- 30622 Via Pared
- 30674 Via Pared
- 30596 Via Pared
- 30700 Via Pared
- 30657 Via Pared
- 30683 Via Pared
- 30631 Via Pared
- 30570 Via Pared
- 30726 Via Pared
- 30605 Via Pared
- 30709 Via Pared
- 30579 Via Pared
- 30544 Via Pared
- 30735 Via Pared
- 30752 Via Pared
- 30680 Robert Rd
- 30628 Robert Rd
- 30602 Robert Rd
- 30706 Robert Rd
Your Personal Tour Guide
Ask me questions while you tour the home.