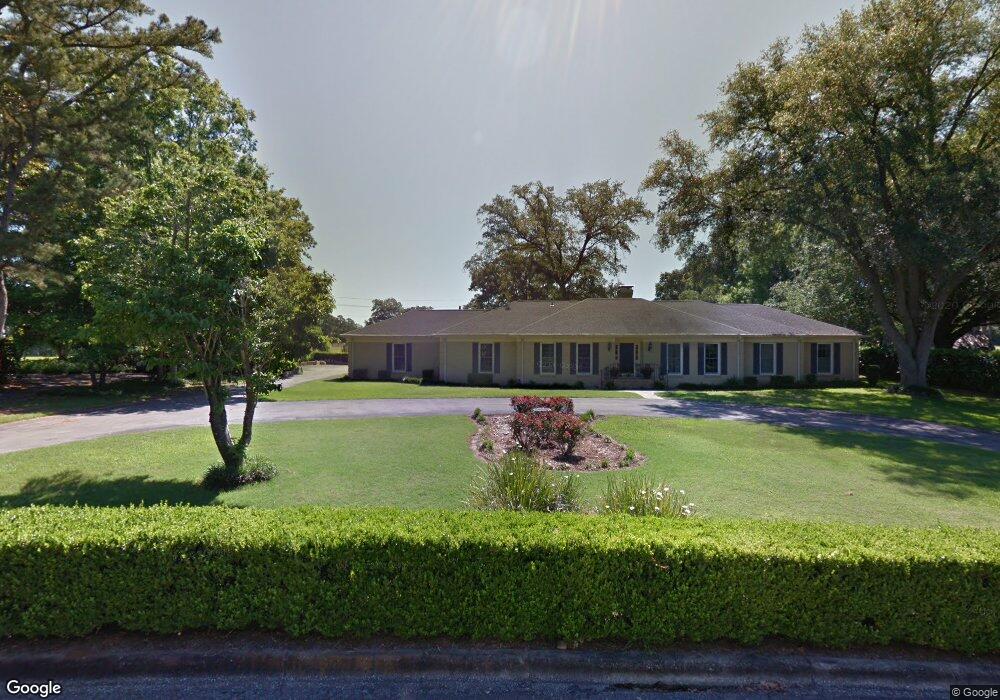
3065 Carlow Cir Tallahassee, FL 32309
Killearn NeighborhoodEstimated Value: $568,386 - $873,000
3
Beds
3
Baths
3,291
Sq Ft
$200/Sq Ft
Est. Value
About This Home
This home is located at 3065 Carlow Cir, Tallahassee, FL 32309 and is currently estimated at $656,847, approximately $199 per square foot. 3065 Carlow Cir is a home located in Leon County with nearby schools including Gilchrist Elementary School, William J. Montford III Middle School, and Lincoln High School.
Ownership History
Date
Name
Owned For
Owner Type
Purchase Details
Closed on
Nov 5, 2008
Sold by
Spooner Bryan A
Bought by
Spooner Bryan A and Spooner Sharon Hail
Current Estimated Value
Purchase Details
Closed on
Apr 1, 2008
Sold by
Spooner Jennifer E
Bought by
Spooner Bryan A
Purchase Details
Closed on
Jul 25, 2003
Sold by
Manausa Joseph P and Manausa Michelle L
Bought by
Spooner Bryan A and Spooner Jennifer E
Home Financials for this Owner
Home Financials are based on the most recent Mortgage that was taken out on this home.
Original Mortgage
$352,000
Outstanding Balance
$149,427
Interest Rate
5.24%
Mortgage Type
Purchase Money Mortgage
Estimated Equity
$507,420
Purchase Details
Closed on
Jul 19, 2001
Sold by
Whetsel John E and Whetsel Dorothea W
Bought by
Manausa Joseph P and Manusa Michelle L
Home Financials for this Owner
Home Financials are based on the most recent Mortgage that was taken out on this home.
Original Mortgage
$272,000
Interest Rate
7.08%
Create a Home Valuation Report for This Property
The Home Valuation Report is an in-depth analysis detailing your home's value as well as a comparison with similar homes in the area
Home Values in the Area
Average Home Value in this Area
Purchase History
| Date | Buyer | Sale Price | Title Company |
|---|---|---|---|
| Spooner Bryan A | -- | Attorney | |
| Spooner Bryan A | -- | None Available | |
| Spooner Bryan A | $440,000 | -- | |
| Manausa Joseph P | $340,871 | -- |
Source: Public Records
Mortgage History
| Date | Status | Borrower | Loan Amount |
|---|---|---|---|
| Open | Spooner Bryan A | $352,000 | |
| Previous Owner | Manausa Joseph P | $272,000 |
Source: Public Records
Tax History Compared to Growth
Tax History
| Year | Tax Paid | Tax Assessment Tax Assessment Total Assessment is a certain percentage of the fair market value that is determined by local assessors to be the total taxable value of land and additions on the property. | Land | Improvement |
|---|---|---|---|---|
| 2024 | $5,501 | $328,945 | -- | -- |
| 2023 | $5,349 | $319,364 | $0 | $0 |
| 2022 | $5,022 | $310,062 | $0 | $0 |
| 2021 | $4,965 | $301,031 | $0 | $0 |
| 2020 | $4,817 | $296,875 | $0 | $0 |
| 2019 | $4,745 | $290,200 | $0 | $0 |
| 2018 | $4,688 | $284,789 | $0 | $0 |
| 2017 | $4,634 | $278,931 | $0 | $0 |
| 2016 | $4,591 | $273,194 | $0 | $0 |
| 2015 | $4,554 | $271,295 | $0 | $0 |
| 2014 | $4,554 | $269,142 | $0 | $0 |
Source: Public Records
Map
Nearby Homes
- 3089 Sawgrass Cir
- 3903 Dunleer Ct
- 3072 Ironwood Dr
- 3884 Paddrick Dr
- 3726 Wicklow Cir
- 3036 Ironwood Dr
- Lot 2 Edenderry Dr
- 3207 Shamrock E Unit 19
- 4012 Dutchess Ct
- 2929 Shamrock St S
- 3109 Shamrock St S
- 2992 Corrib Dr Unit 7
- 2805 Tipperary Dr
- 4022 Delvin Dr
- 2935 Bayshore Dr
- 2913 Springfield Dr
- 3724 Donovan Dr Unit A
- 3577 Stowe Trace
- 4076 Roscrea Dr
- 4134 Arklow Dr
- 3061 Carlow Cir
- 3069 Carlow Cir Unit 6
- 3069 Carlow Cir
- 3058 Carlow Cir
- 3057 Carlow Cir Unit 6
- 3057 Carlow Cir
- 3073 Carlow Cir Unit 3
- 3073 Carlow Cir
- 3841 Longford Dr
- 3052 Carlow Cir
- 3053 Carlow Cir
- 3837 Longford Dr
- 2918 Tyron Cir
- 2917 Tyron Cir Unit 3
- 3049 Carlow Cir
- 3048 Waterford Dr
- 3048 Waterford Dr Unit 8
- 3044 Waterford Dr Unit 8
- 3044 Waterford Dr
- 3048 Carlow Cir