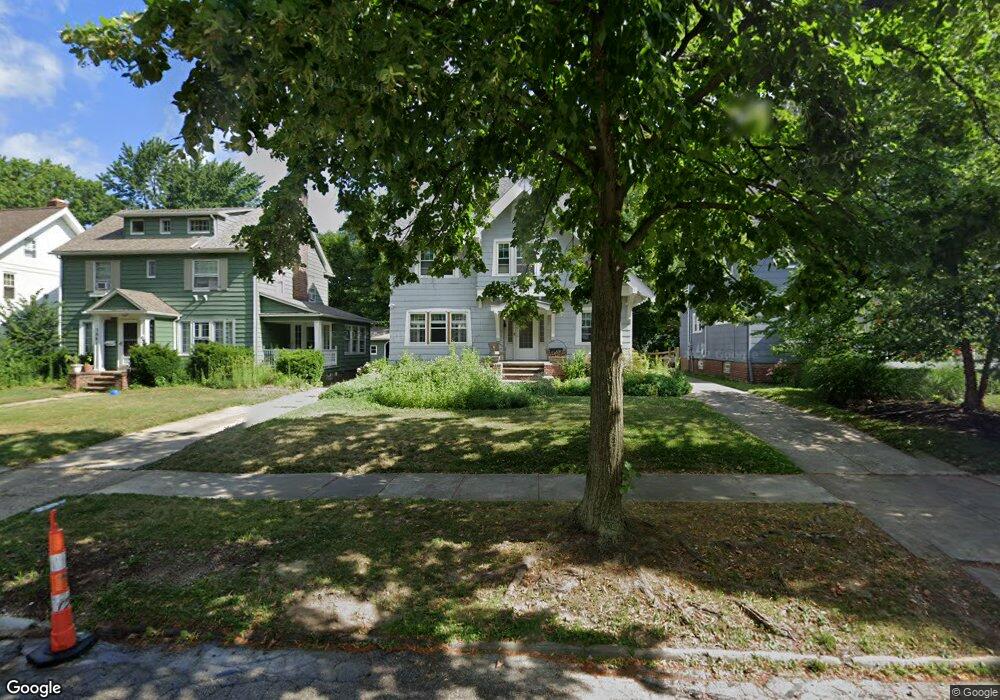
3065 Coleridge Rd Cleveland, OH 44118
Estimated Value: $308,000 - $360,000
3
Beds
2
Baths
1,846
Sq Ft
$180/Sq Ft
Est. Value
About This Home
This home is located at 3065 Coleridge Rd, Cleveland, OH 44118 and is currently estimated at $331,443, approximately $179 per square foot. 3065 Coleridge Rd is a home located in Cuyahoga County with nearby schools including Fairfax Elementary School, Roxboro Middle School, and Cleveland Heights High School.
Ownership History
Date
Name
Owned For
Owner Type
Purchase Details
Closed on
Sep 9, 2020
Sold by
Pershey Edward J and Pershey Monica G
Bought by
Pershey Dr Monica Gordon and The Dr Monica Gordon Pershey T
Current Estimated Value
Purchase Details
Closed on
Aug 30, 1995
Sold by
Taylor Scott P
Bought by
Pershey Edward J and Pershey Monica G
Home Financials for this Owner
Home Financials are based on the most recent Mortgage that was taken out on this home.
Original Mortgage
$114,000
Interest Rate
7.1%
Mortgage Type
New Conventional
Purchase Details
Closed on
Aug 19, 1993
Sold by
Kenat Martha
Bought by
Taylor Scott P
Purchase Details
Closed on
Aug 16, 1976
Sold by
Kenat Ralph C and Kenat Martha
Bought by
Kenat Martha
Purchase Details
Closed on
Jan 1, 1975
Bought by
Kenat Ralph C and Kenat Martha
Create a Home Valuation Report for This Property
The Home Valuation Report is an in-depth analysis detailing your home's value as well as a comparison with similar homes in the area
Home Values in the Area
Average Home Value in this Area
Purchase History
| Date | Buyer | Sale Price | Title Company |
|---|---|---|---|
| Pershey Dr Monica Gordon | -- | None Available | |
| Pershey Edward J | $142,500 | -- | |
| Taylor Scott P | $110,000 | -- | |
| Kenat Martha | -- | -- | |
| Kenat Ralph C | -- | -- |
Source: Public Records
Mortgage History
| Date | Status | Borrower | Loan Amount |
|---|---|---|---|
| Closed | Pershey Edward J | $114,000 |
Source: Public Records
Tax History Compared to Growth
Tax History
| Year | Tax Paid | Tax Assessment Tax Assessment Total Assessment is a certain percentage of the fair market value that is determined by local assessors to be the total taxable value of land and additions on the property. | Land | Improvement |
|---|---|---|---|---|
| 2024 | $6,876 | $91,000 | $17,955 | $73,045 |
| 2023 | $6,341 | $67,620 | $15,400 | $52,220 |
| 2022 | $6,353 | $67,620 | $15,400 | $52,220 |
| 2021 | $6,224 | $67,620 | $15,400 | $52,220 |
| 2020 | $6,040 | $60,380 | $13,760 | $46,620 |
| 2019 | $5,706 | $172,500 | $39,300 | $133,200 |
| 2018 | $2,854 | $60,380 | $13,760 | $46,620 |
| 2017 | $6,213 | $61,080 | $11,900 | $49,180 |
| 2016 | $6,200 | $61,080 | $11,900 | $49,180 |
| 2015 | $5,376 | $61,080 | $11,900 | $49,180 |
| 2014 | $5,376 | $56,570 | $11,030 | $45,540 |
Source: Public Records
Map
Nearby Homes
- 3075 Coleridge Rd
- 2984 Corydon Rd
- 2995 Essex Rd
- 3115 Essex Rd
- 2945 Corydon Rd
- 2248 Rexwood Rd
- 2244 Rexwood Rd
- 3181 Scarborough Rd
- 2383 Lee Rd
- 2480 Lee Rd
- 2875 Coleridge Rd
- 2914 Clarkson Rd
- 2185 Rexwood Rd
- 2967 Meadowbrook Blvd
- 2206 Westminster Rd
- 2189 Edgewood Rd
- 2185 Edgewood Rd
- 3277 E Scarborough Rd
- 2965 Fairmount Blvd
- 2831 Fairmount Blvd
- 3071 Coleridge Rd
- 3061 Coleridge Rd
- 3055 Coleridge Rd
- 3081 Coleridge Rd
- 3051 Coleridge Rd
- 3064 Corydon Rd
- 3068 Corydon Rd
- 3060 Corydon Rd
- 3054 Corydon Rd
- 3074 Corydon Rd
- 3085 Coleridge Rd
- 3045 Coleridge Rd
- 3050 Corydon Rd
- 3064 Coleridge Rd
- 3080 Corydon Rd
- 3070 Coleridge Rd
- 3060 Coleridge Rd
- 3074 Coleridge Rd
- 3054 Coleridge Rd
- 3091 Coleridge Rd